

Wizz Air✈️ (LON: WIZZ) — Full thesis
Came for the value, stayed for the growth.

Hello again, reader. This blog recently reached 400 subscribers—quite an achievement, considering the dense material I write. If you're a regular, you know my policy: ❌No oversimplifications. ❌No marketing fluff. ❌No filler posts. Only deep research on companies I invest in, personally and professionally. And that's why my subscribers include analysts, fund managers, and even some insiders from the companies I analyze.
After a few months of discarding a couple of companies in the early analysis phase (I might write about them later), WizzAir, the 'Ryanair of Eastern Europe,' came onto my radar. I owe this idea to the Spanish value fund, Cobas Internacional. There's nothing a value investor loves more than a temporary problem mixed with a dose of pessimism surrounding a company or sector. And that, without a doubt, is what drew me to this company.
In any analysis, you eventually reach a point where you get a rough idea of how much margin of safety is left in the price. If that margin is already tight—if the market has already priced in the temporary nature of the problems—it might be time to close the file and move on. But WizzAir has some very interesting ingredients, and I can tell you it's the first company I've done a deep dive on where I seriously see the potential for it to be a 'multi-bagger'.
I can truly say: I came for the value, stayed for the growth. Let’s go!
WizzAir is a low-cost airline. Founded in 2003 by its current CEO, József Váradi, and modeled after Ryanair, it has succeeded in becoming the airline with the lowest operating costs in the European market, positioning itself as one of the leading low-cost carriers in Central and Eastern Europe.
Its low-cost model is based on three pillars:
Targeting untapped European markets where its competition has primarily been national flag carriers and other major non-low-cost (or legacy) European airlines. (Romania, Bulgaria, Poland, and Hungary are the main origins for its routes).
Low operating costs in these countries, which are still converging with the European average.
A modern and homogeneous fleet (average age of 4.7 years vs. Ryanair's 10), mainly consisting of the Airbus A321neo. This model stands out as the most efficient new-generation, single-aisle aircraft, with up to 20% greater efficiency than the previous generation and 2-4% better than the Boeing MAX 10.
The track record of its largest shareholder, Indigo Partners (24% shares), in managing low-cost carriers provides strong validation. Indigo is an American private equity fund founded in 2002 by Bill Franke, an entrepreneur widely regarded as a pioneer of the low-cost model in aviation. Furthermore, Bill Franke serves as the Chairman of WizzAir.
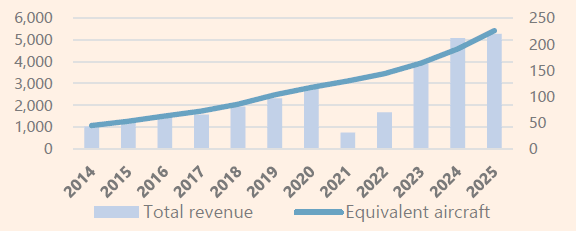
The success of its business model has enabled the company to achieve a fivefold increase in both revenue and fleet size, driven by a Compound Annual Growth Rate (CAGR) of over 15% since 2014.The company is investing in its continued growth. WizzAir has a firm order with Airbus for the delivery of 289 new A321neos through 2030-2032.
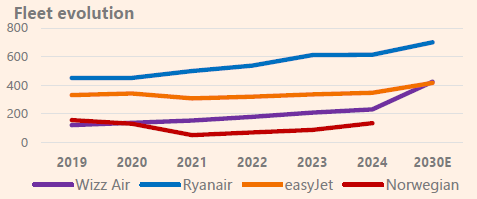
This order, originally placed in late 2017 (with subsequent modifications and rescheduling), represents an 84% increase in its fleet size over the next 6-8 years. This compares to a 14% growth for Ryanair, and would position WizzAir to rival EasyJet for the second-largest low-cost fleet in Europe, ahead of Vueling and Norwegian.
In the current environment, this contract provides an advantage due to the bottlenecks that manufacturers are experiencing in engine forging and supply chains. Airbus and Boeing have full backlogs with over 17,000 aircraft, equivalent to 14 years of deliveries.
AerCap CEO: Stated that a shortage of aircraft is set to continue for years, and that while manufacturers will eventually ramp up production, it will be 'several years' before they meet their targets.
Although easyJet and Ryanair also have large firm orders, the average age of their fleets (10 years) requires them to undertake more renewals. In easyJet's case, they expect to drive growth more through the number of seats on new aircraft (upgauging) rather than by increasing their net fleet size.
Furthermore, this coincides with a moment when the fleet retirement rate is expected to accelerate from 2-3% to 4% annually by 2043, due to both the average age of the fleet and environmental targets.
EASA: “Fleet renewal rates in Europe are expected to accelerate in the coming decade, with annual retirements increasing compared to the historical average, driven by environmental targets, operational costs and regulatory measures.”
It's the ideal scenario: supply-side constraints in an environment of stable-to-growing demand.
IATA: expecting passenger demand to increase by 8% and available capacity to increase by 7%.
Despite its current high-growth phase, WizzAir's recent fleet expansion has created a temporary headwind that is driving the decline in its stock price, even amidst the sector's post-pandemic recovery.
Engine Issues
WizzAir has been severely impacted by a defect from engine manufacturer Pratt & Whitney, stemming from a metal powder issue that affects the engine's durability. The affected A321neo aircraft require unscheduled and extensive inspections (lasting around 300 days).
WizzAir is one of the largest operators of this engine variant, which has made it particularly exposed to this problem. The manufacturer has compensated the company with over €552 million (cumulative for 2024 and 2025), with the expectation of receiving further compensation.
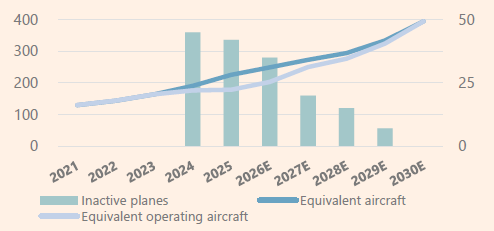
During FY2024 (April 2023 – March 2024), WizzAir had 45 grounded aircraft, and 42 in FY2025, representing 23% of its fleet. This issue is expected to impact the fleet through 2029-2030, albeit to a lesser extent from 2027 onwards.
This situation has led to margin deterioration by increasing direct fixed costs without a corresponding ability to increase available seats. The compensation payments do not fully offset the opportunity cost of the grounded fleet and the incremental costs incurred, which will be discussed later.
The market punished the stock during two "black weeks," which coincided with the release of its annual results:
In the week of July 29, 2024, the company released its FY2024 results, leading to a 30% drop in its stock price. This was primarily due to rising unit costs (CASK), the outlook for further increases in FY2025, and the suspension of guidance due to a lack of visibility.
In the week of June 2, 2025, WizzAir presented its annual results, triggering a nearly 25% decline in its stock. The drop was caused by a sharp increase in operating costs and the lack of guidance for the following fiscal year due to poor visibility.
The lack of visibility on the normalization of unit costs—a key metric for a low-cost carrier—driven by both the P&W engine failures and general cost inflation, has unleashed pessimism surrounding the stock. Some investors have accused management of being unclear, and even misleading, regarding the company's operational performance.
Based on the situation described, we can separate the analysis of the company's potential value into two parts:
The potential value from normalizing the engine issues, which would in turn normalize the cost structure. This part of the analysis will provide visibility on the investment thesis's margin of safety and on how growth can be projected. Let’s call it, the “value leg”.
The potential value from fleet and efficiency growth, which involves factors such as the macroeconomic environment, the industry's capital cycle, and the ability to pass on cost increases through ticket prices. Yes, you guessed it, this will be the “growth leg”.
The value leg
In fiscal year 2025, revenue growth was driven by improved load factors and higher revenue per passenger:
Revenue: +3.8%
Load Factor: 91.2% (+1.1 p.p.)
Revenue per Passenger-Kilometer: +2.7%
Available Seat Kilometers (ASKs): -0.06%
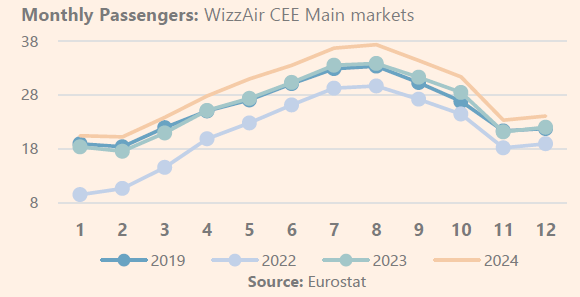
Despite a net increase in the equivalent fleet of 35 aircraft (+20%), ASKs remained flat due to the grounding of 42 planes because of the P&W engine issues. This occurred during a fiscal year (April 2024 - March 2025) when the sector's recovery in Europe reached pre-pandemic levels, even surpassing them in Central and Eastern European (CEE) markets—WizzAir's core markets.
Increases in the cost structure, driven by aircraft groundings and inflation, have brought the EBIT margin down to 3.2%, compared to 8.6% in FY2024.
At FY2024 margins, and after adding back the volume lost from the grounded aircraft, the potential EBIT would be €540 million, versus the €168 million reported. However, cost and revenue dynamics have changed (and not just temporaly), so we will analyze the effect of each item individually.
Increase in Unit Costs (CASK) Related to Depreciation
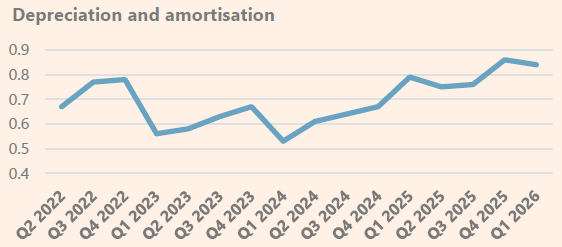
Despite an 18% increase in the equivalent fleet in FY2025, Available Seat Kilometers (ASKs) remained flat compared to 2024. Assets on the balance sheet depreciate whether they are flying or not, especially those under sale-and-leaseback agreements (where the Right-of-Use asset is depreciated). Furthermore, the company acquired spare engines, increasing the numerator (costs) of the unit cost formula while the denominator (ASKs) remained the same. The increase in depreciation was 28%.
As we can see, as the load factor recovered post-pandemic (Q2 2022 – Summer 2021), the allocation of the fleet's depreciation cost began to normalize (the pre-pandemic level was €0.55 cents per ASK).
Another factor that has increased depreciation is the scheduled maintenance on the A321ceo aircraft, whose leases have been renegotiated to cover for the grounded planes. Upon reaching a certain number of flight hours, components must be replaced and their cost capitalized (and then amortized) so that the aircraft can be returned to the lessor without penalty.
For FY2025, the company provides the unit cost impact, broken down into the effect from the grounded fleet and the excess cost from the aircraft with extended contracts. There is an additional, unexplained effect, which they quantify at €0.07 cents, that has not been taken into account in this analysis.
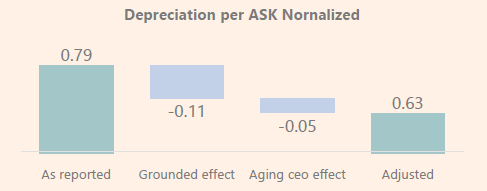
The total effect of €0.16 cents represents a 370 basis point (bps) impact on the EBIT margin.
Increase in Unit Costs (CASK) Related to Maintenance
The renegotiated operating leases (sale-and-leaseback) have resulted in higher maintenance costs due to the grounding of the A321neos. Another factor impacting these costs is the maintenance for scheduled parts replacement on aircraft with extended contracts, similar to the depreciation issue.
For FY2025, the company provides the impact on maintenance unit cost, broken down by the effect of the grounded fleet and the excess cost of aircraft with extended leases. There is an additional, unexplained effect, which they quantify at €0.01 cents, that has not been taken into account in this analysis.
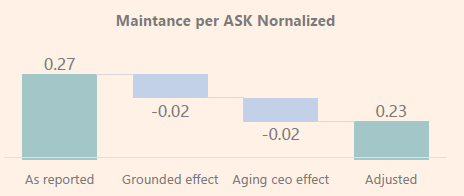
The total effect of €0.04 cents translates into a 92 basis point (bps) impact on the EBIT margin.
Increase in Unit Costs (CASK) Related to Staff
In FY2025, staff costs increased by 11%, compared to 3.8% revenue growth. Part of this was due to wage inflation and a country mix effect (+6%).
Cabin crew headcount increased by 1%, versus a 0.06% decrease in ASKs. The company expects fleet growth in the coming years and needs to increase staffing in advance, thereby accepting a degree of short-term inefficiency. This can be observed in the following chart: in periods of growth (green area), headcount increases at a faster rate than total ASKs, reducing productivity as measured by ASKs per employee. In the red area, despite an increase in the load factor, productivity has declined due to a larger increase in personnel.
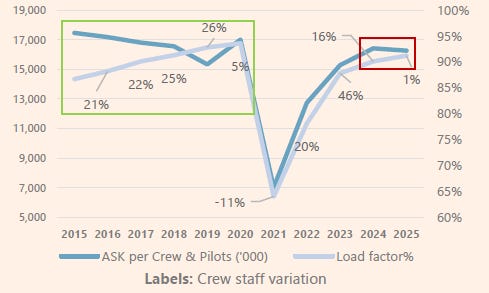
The margin impact of this inefficiency is €0.04 cents per ASK.
Separately, administrative and other staff (G&A) grew by 30%, increasing from 10% of sales to 13%. Allocating this same staff expense over the potential ASKs of the grounded fleet represents a margin impact of €0.01 cents per ASK. The total effect of €0.05 cents translates into a 113 basis point (bps) impact on the EBIT margin.
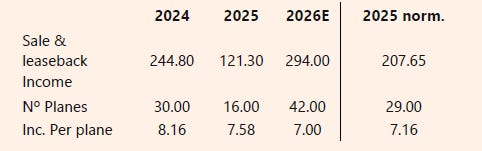
Income from Sale & Leaseback
The sale-and-leaseback model involves selling an aircraft to a lessor, who then leases it back to the airline under an operating lease (with no purchase option). WizzAir negotiates prices and deliveries with Airbus on a 10-year (or more) forward basis. Although prices have variable components, on large, discounted orders and under current market conditions, market prices are often higher than the cost paid by WizzAir. This generates one-off accounting income (upfront income) that is recognized at the time of the sale to the lessor.
Airbus delivery delays meant that in FY2025, only 16 aircraft were delivered via sale-and-leaseback, compared to 30 in FY2024 and the 42 expected in FY2026.
By normalizing the 2025 and 2026 figures, the hypothetical impact on FY2025 revenue would be an increase of €86 million.
Changes in Other Operating Income and Expenses
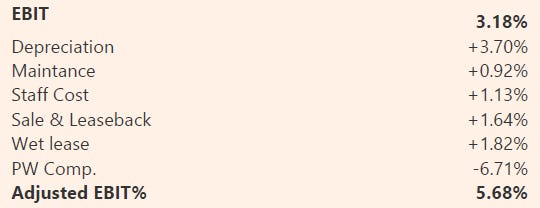
The company has utilized "wet leases" (leasing an aircraft complete with crew, maintenance, and insurance from a third party) to bolster its capacity during key periods of the year. This arrangement reduces margins and, at times, these flights are even operated at a loss to maintain customer service. Although this is a common practice for airlines, the impact in FY2025 was substantial at €113 million, compared to €17 million in FY2024 and €3 million in FY2023. Normalizing this expense has an impact of €0.08 cents per ASK and translates to a +182 basis point (bps) increase in the EBIT margin.
Pratt & Whitney paid WizzAir compensation for the groundings, amounting to €354 million in FY2025. For normalization purposes, this one-off income must be subtracted from the results. This adjustment has an impact of -€0.29 cents per ASK, or a -671 basis point (bps) effect on the EBIT margin.
The summary of the adjustments is as follows:
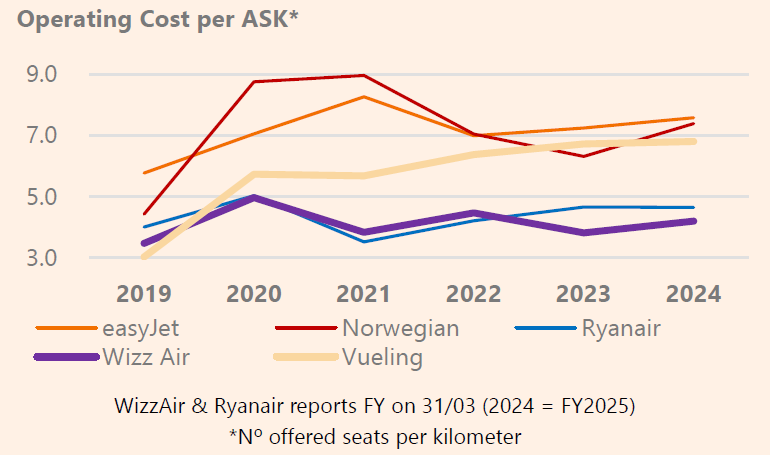
We can strengthen the argument with a comparison of cost evolution against Ryanair.
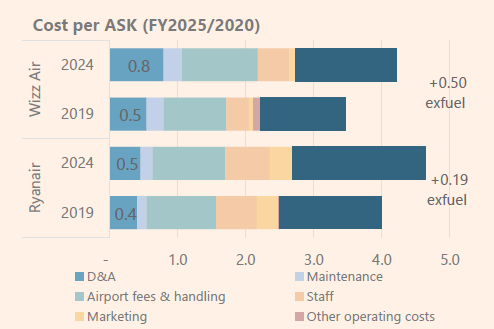
We can see that there is indeed a clear divergence in the evolution of maintenance and D&A expenses between the two companies, although WizzAir remains the overall cost leader.
The result, after incorporating the idle capacity, would increase FY2025 EBIT by 121% to €370 million, implying an EV/EBIT multiple of 15.6x. Ryanair trades at around 11-12x, which leaves a very limited margin of safety. This suggests that the market is already pricing in the cost normalization following these temporary issues.
However, we are leaving out several important factors:
WizzAir has secured access to a new fleet in a supply-constrained market.
The opportunity to generate income from sale-and-leaseback transactions in this high-pressure environment.
The new fleet is more fuel-efficient, and a younger average fleet age reduces maintenance costs.
Its core markets (Central and Eastern Europe) can grow at a faster pace than traditional markets.
Isn't the 'growth' component worth analyzing? I certainly think it is.
The growth leg
WizzAir faces the challenge of absorbing nearly 40 new aircraft per year through 2030 without diluting its revenue per passenger. They are supported by a strong track record of consistent fleet growth, as we can see in the following chart.
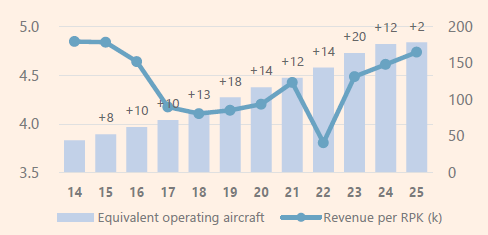
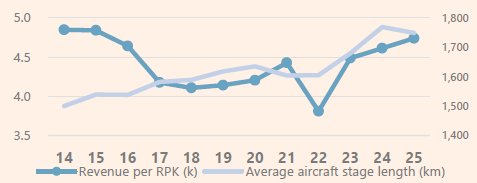
RPK (Revenue per Passenger-Kilometer) decreased as the company operated longer routes up until 2018. Longer routes generate lower RPK because the fixed costs of getting an aircraft "in the air" (such as airport fees) are spread over more kilometers. The lower marginal cost of additional flight hours compared to the fixed costs allows for a lower unit price per kilometer.
Once the route network reached a certain level of distance efficiency, this metric began to grow steadily (with the exception of the pandemic) at an annualized rate of 2.4%.
Revenue per passenger-kilometer (RPK) grew by 1.6% in FY25, following 7% growth in the prior year. In Q1 FY26, it increased by 2%, but the company has issued guidance for Q2 (the summer peak) to be flat year-over-year. (Source: Q1 FY26 web conference).
Despite sustained annualized growth of 2.4% since FY2020 (pre-pandemic), the resistance to breaking the €6.00 cent per RPK barrier during the high season is indicative of markets with considerable price elasticity, even during peak travel times.
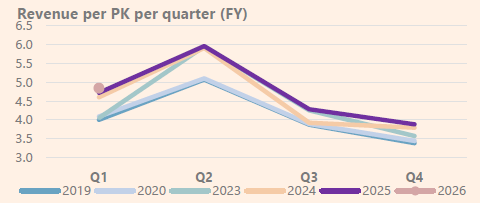
This pricing ceiling could begin to break with higher growth in per capita income in WizzAir's core economies (which would also drive higher load factors) and with growing tourist interest in these regions. Indeed, the economies where the airline operates still have significant room for convergence with the EU and Euro area averages.
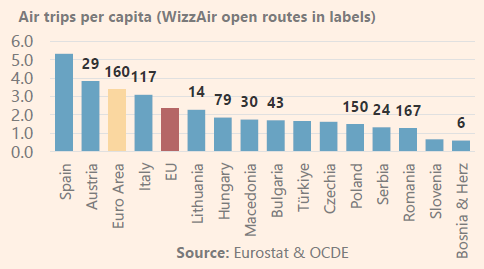
At its 2024 Capital Markets Day, the company outlined this same line of reasoning, although using different trips-per-capita data than what is presented here. This is likely due to a different methodology—the company's figures probably only include domestic travelers—but the conclusions remain the same.
In that same presentation, they attributed their projected fleet growth of 295 aircraft as follows: 165 from the convergence in trips per capita, 110 from market share gains, and the remainder to a recovery in Ukraine and Israel.
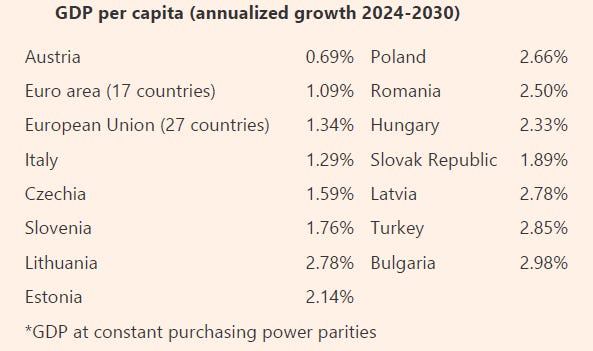
GDP per capita growth forecasts from the OECD through 2030 show higher growth rates in the economies where WizzAir has its main presence.
Fuel Cost: Efficiency and Medium-Term Fuel Price Convergence
The price of fuel is the most critical variable factor for the company's margins due to its high volatility. Despite its hedging strategy—for example, in FY2025, the company had 70% of its estimated consumption hedged—it remains a key determinant of profitability.
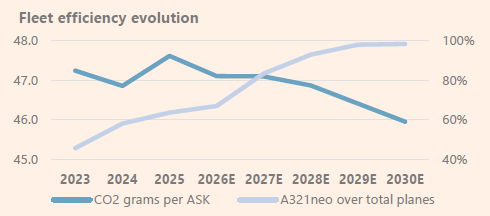
WizzAir operates the most efficient fleet and has prospects to further improve this efficiency as the A321neo's share of the total fleet increases, and as the issues related to their technical groundings are resolved.
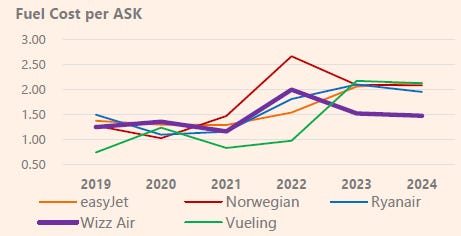
More critical than fleet efficiency, however, is the price of fuel, and in this regard, there have also been several years of excess costs.
In Q1 FY2026 (April – June 2025), the price paid for fuel hit a 5-year low, and the EUR/USD trend was favorable for European airlines (although the floor on its hedges prevented the company from capturing the full benefit).
It is expected that oil demand will continue to grow in a scenario of underinvestment in new oil fields.
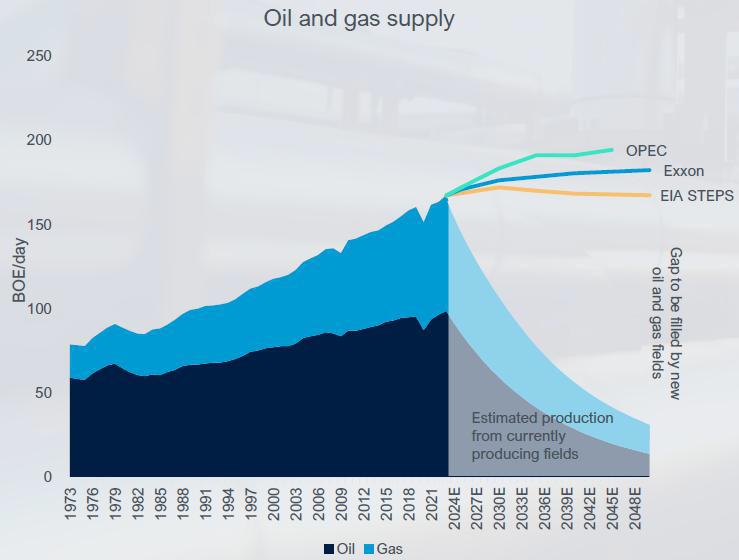
Even if growth is moderate, this imbalance between supply and demand will sooner or later drive fuel prices up again. Therefore, given the lack of visibility, the normalized scenario is projected using a fuel price of $900 per ton.
Ex-Fuel Costs: Inflation Combined with a Dilution of the Grounded Fleet Effect
We have already discussed at length the cost impact of the grounded fleet. This problem will extend through 2029-2030, though its impact will be greatly minimized from FY2028 onwards. In the meantime, these cost lines are experiencing inflation, particularly airport and handling fees.
A 2% annual inflation rate has been projected for these costs through 2030, starting from the normalized base.
Income from Sale & Leaseback
WizzAir uses different financing models that can be summarized into two types: owned models (Finance Lease, JOLCO, FTL) and operating leases without a purchase option (sale-and-leaseback).
The company aims to converge towards a model where 40-50% of the fleet is owned by 2030-2032, seeking to improve its credit rating and, consequently, its cost of capital, bringing it closer to Ryanair's.
Currently, forcing this transition would not make strategic sense, given that due to supply chain bottlenecks and the favorable prices agreed to in 2017 (since updated), the company earns between €7 and €8 million per aircraft delivered via sale-and-leaseback.
In fact, on the Q1 FY2026 conference call, the company announced that 82% of deliveries for FY2026 would be structured as sale-and-leaseback transactions.
The downside is that these contracts typically last 8-9 years, and at the end of the term, the company does not own the productive asset, which could otherwise be liquidated or have its useful life extended to 15-20 years in times of difficulty.
In our model, we assume that this capital gain gradually decreases as we approach 2030 and the bottlenecks ease. Therefore, by the end of FY2030, the company is expected to progressively return to a 30/70 model.
The company does not disclose the purchase price of its new fleet, but through extrapolation, it has been deduced that each A321neo costs between €60-65 million. This figure has been corroborated by external sources, such as AerCap, which is involved in financing these types of transactions.
Valuation
As we saw in the 'value' portion of the thesis, the temporary situation with the grounded planes is already reflected in the stock price. While any value thesis must contend with uncontrollable variables, in a case like this, the multitude of factors (fuel, regulation, airport fees, competition, manufacturers) makes it impossible to arrive at a single price target; one can only determine a range of probable scenarios.
Starting from the modeled unit cost structure, four scenarios for EPS (Earnings Per Share) have been simulated through 2030.
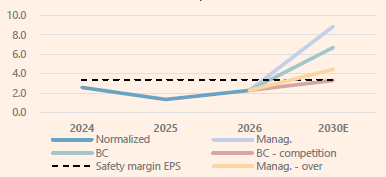
The Management Scenario assumes 11% annualized fleet growth through 2030, a 91% load factor, and 2% annualized RPK growth (in line with expected GDP per capita growth and cost inflation).
The Management Scenario – Overcapacity also assumes 11% annualized fleet growth, but posits that the market cannot absorb all this capacity, causing the load factor to drop to 87% and only partially offsetting inflation (with 1.8% annualized RPK growth).
The Base Case moderates fleet growth to 5% due to intensifying supply chain bottlenecks or a strategic rescheduling of deliveries. It assumes a 91% load factor and annualized RPK growth equal to inflation.
The Base Case with Intensified Competition reduces the load factor to 90% and RPK growth to just 1% (1 percentage point below cost inflation).
The dotted line, 'Safety Margin EPS,' represents the 2030 EPS required to justify an 80% return on the current price, assuming an exit P/E multiple of 8x.
As we can see, the margin of safety is met in all of the analyzed scenarios.
Conclusion
WizzAir has many of the ingredients, both internal and external, to become a "multi-bagger" stock.
It is the industry's cost leader and is well-established in its core markets, which also have positive growth prospects.
The industry is benefiting from growth trends in tourism, further bolstered by tighter supply constraints caused by both manufacturer bottlenecks and a higher retirement rate for an aging global fleet.
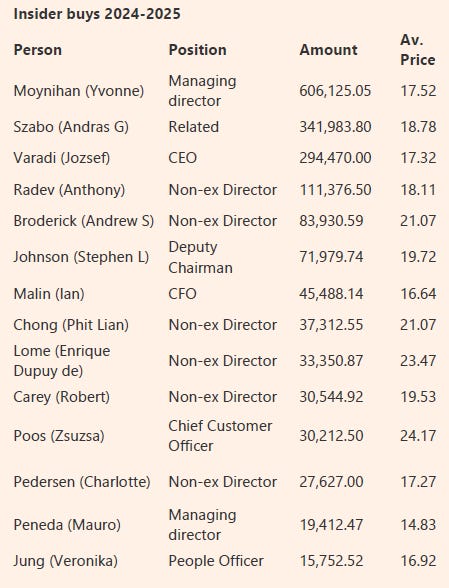
The company has the youngest, most efficient, and most homogeneous fleet. It is backed by an activist investor fund with expertise in low-cost airlines, has a founder-CEO with significant ownership, and, furthermore, insiders are buying—betting on the long-term potential over the current temporary issues.
The conclusion of this analysis, even though the company fits the "growth" stock framework, is that at current prices, it represents a very good investment. Moreover, the scenario analysis indicates a margin of safety of over 80% relative to the current price, even in less optimistic scenarios.
And one final point: The founder and CEO, József Váradi, retains a 1.5% stake, and insiders have been active buyers since 2024, taking advantage of the company's temporary issues.
Thanks for reading, don't forget to subscribe and comment
DISCLAIMER: All the information provided in this document is purely informative and does not constitute a buying recommendation (according to Spanish Law Article 63 of Law 24/1988, of July 28, on the Stock Market Regulator, and Article 5.1 of Royal Decree 217/2008, of February 15). DuckPond Value Research is not responsible for the use of this information. Before investing in a real account, it is necessary to have the appropriate training or delegate the task to a duly authorized professional.
Reach us on duckpond@duckpondvr.com
Great article. I am a suffering holder but see the light at the end of the tunnel and the recovery by ~end of next year, one the P&W engine issues have been resolved.
I initially liked their expansion into the middle east, but have since cut that. This could be considered good news to focus on their core market
Great article! How do you see the debt issue?