

Foraco (TSE: FAR) - Full thesis
A small-cap second derivative play on gold/copper fever

Today, I present a thesis that puts me in a somewhat compromising position.
We are talking about a small-cap company with low liquidity, operating in a highly cyclical sector far removed from the consumer, and generally ignored by financial markets.
Normally, this list would form a checklist of red flags. But in this case, there are so many structural macro aspects and so much backing from global trends that one simply cannot look the other way. If you read the Pond Journal #4 , you have an idea of where this is going. If not, we are about to dive deep.
First, a short lesson on economics, which I believe is crucial here:
The economist Carl Menger coined the term “first-order goods” for consumer goods, and “goods of a higher order” for those that enable or facilitate the production of consumer goods.
Goods of a higher order have varying degrees. For example: the electrical wiring powering my computer is a higher-order good relative to electricity consumption. This wiring is one step removed from consumption (or two, if I were monetizing this 😂).
But for that wire to reach the wall, a wire-drawing factory had to stretch the metal; one step back, a smelter had to process cathodes; and before that, a flotation plant had to treat crushed rock. Pulling the thread, you eventually reach a mine. But that is not the end.
About ten years before extraction began, a mining company hired the drilling services of our company today to verify if, beneath the surface, there was a copper deposit worth extracting.
This distance from the final consumer is the root cause of the extreme cycles we are about to analyze. In economics, this is known as the Bullwhip Effect: a minor fluctuation in end-consumer demand amplifies as it moves upstream through the supply chain. By the time that signal reaches the very beginning—exploration drilling—it has transformed into a violent swing.
The company is Foraco International SA (TSX:FAR), and its sector is Drilling Services.
Foraco is a company of French origin, based in Ontario, currently offering services in 17 countries, including the world’s major mining companies.
Simply put: they drill the ground, providing the machinery and personnel to do so, charging a price per meter drilled. Typically, miners tender projects, and Foraco and its competitors submit technical and economic bids where price, service quality, and equipment availability play a key role.
The occupation ratio of drilling equipment, measured as rig utilization, determines the level of revenue and profitability in an activity with high operating leverage.
In addition to mining drilling services, Foraco has a powerful segment dedicated to Water : drilling wells for consumption, industry, or services related to the mines themselves.
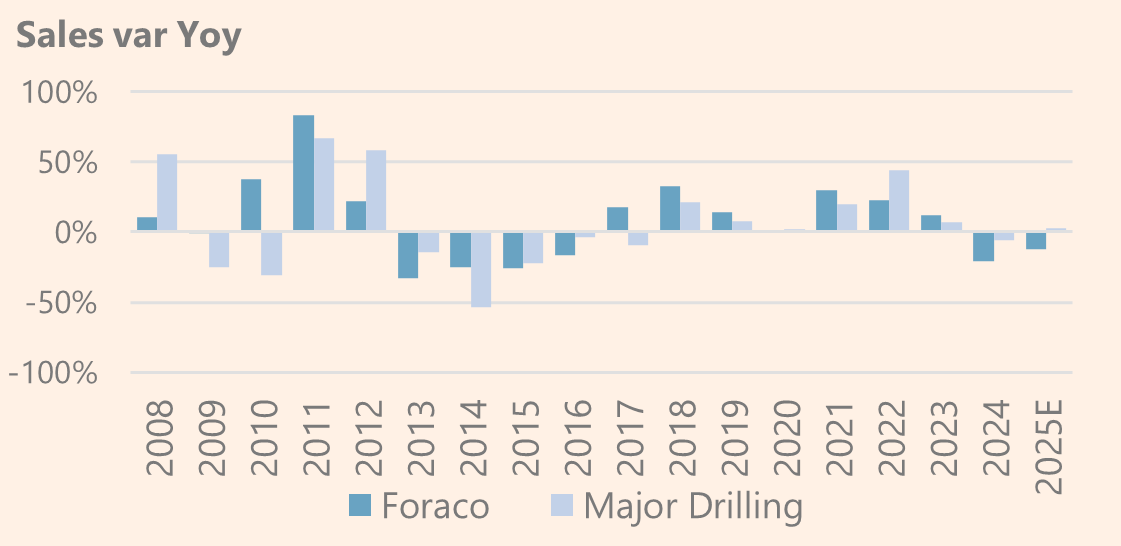
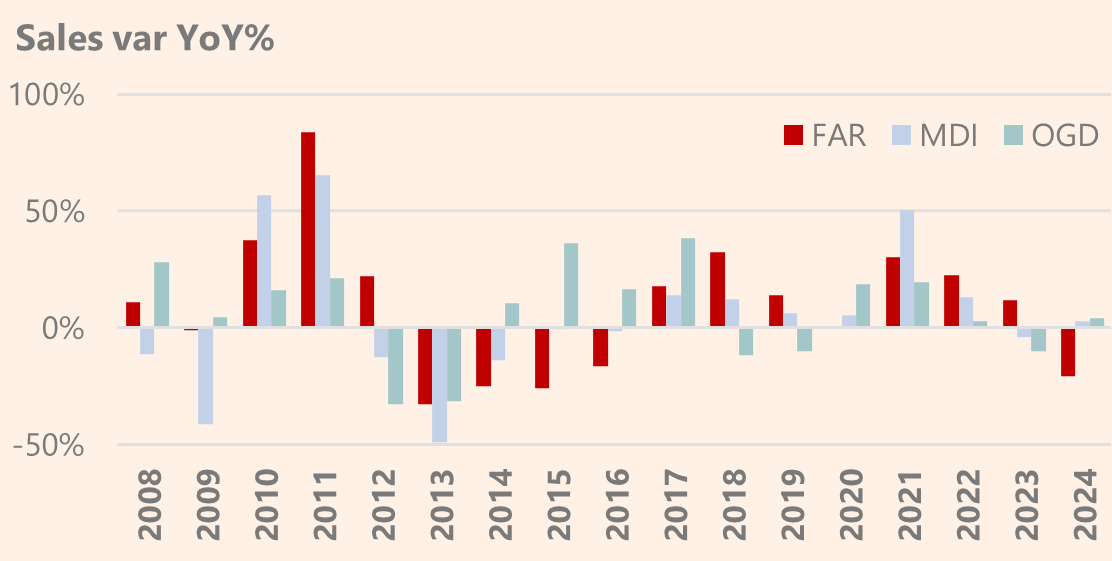
Demand for drilling services is highly cyclical, fluctuating due to macro dynamics and the individual dynamics of each mineral. Mid-double-digit sales variations for several consecutive years are not uncommon, as seen in Foraco and the sector’s largest listed company, Major Drilling .
Furthermore, depending on the moment in the cycle, the predominant type of exploration and client type changes .
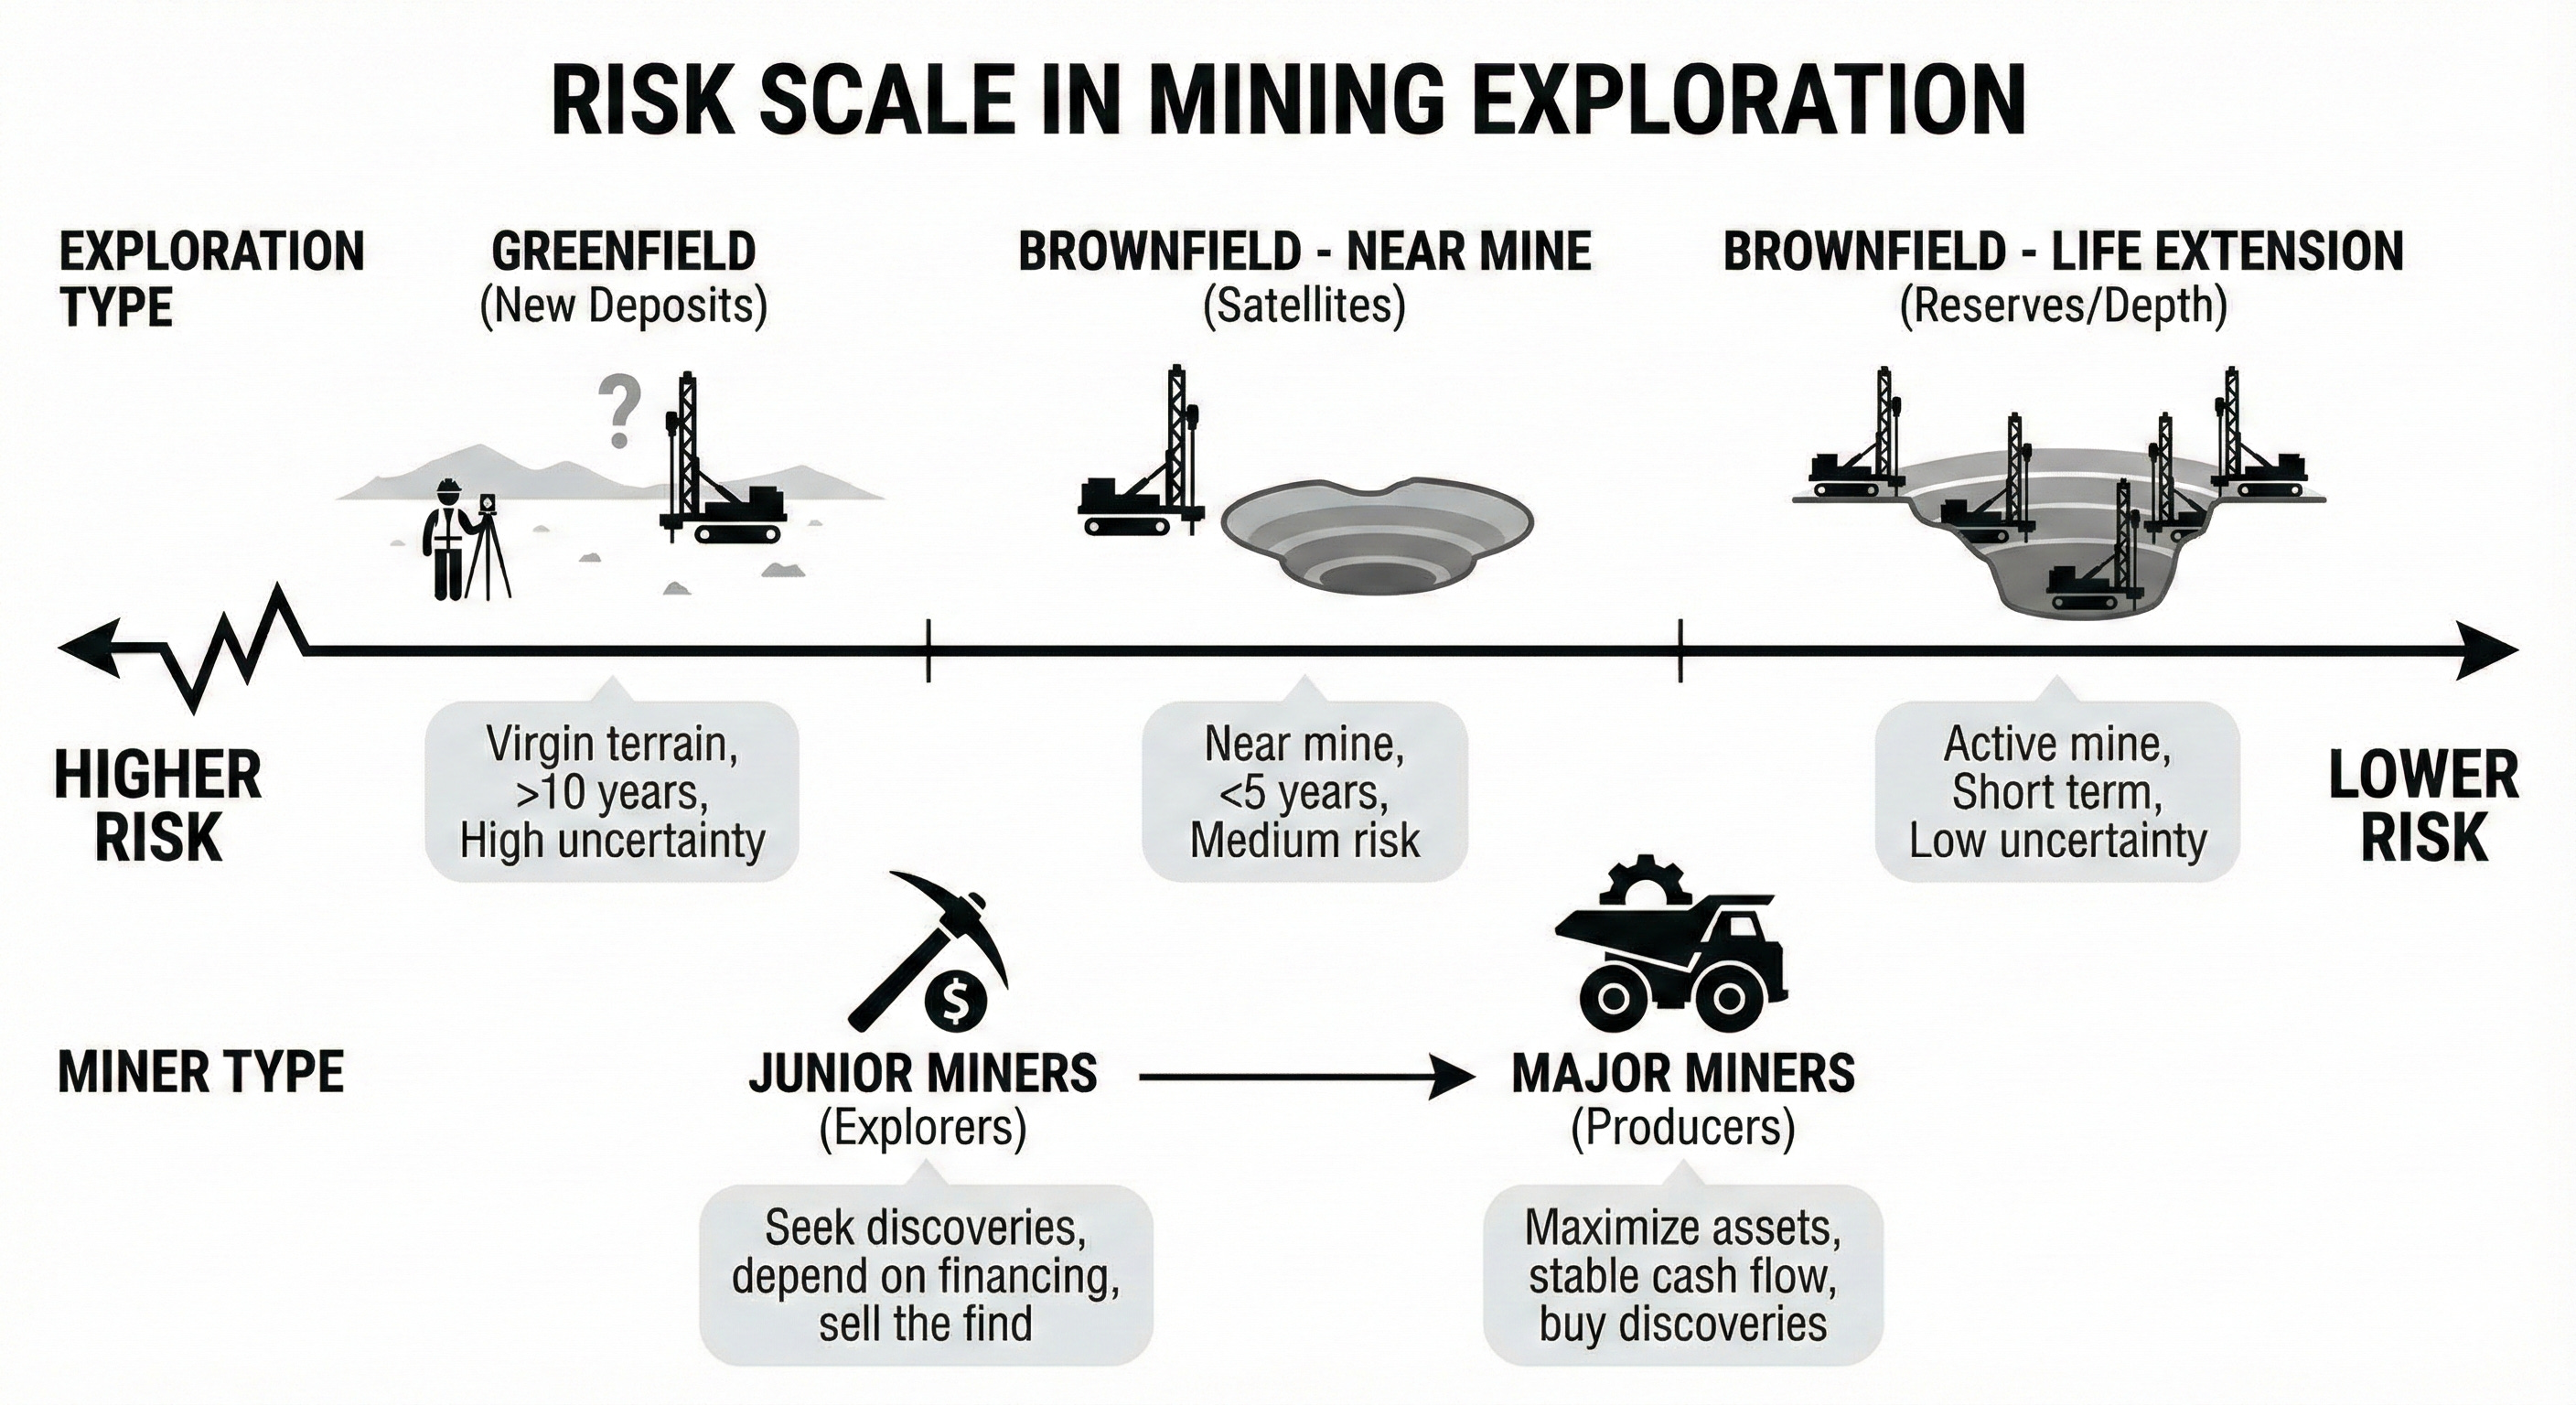
Brownfield projects and other necessary tasks throughout the mine’s life (including closure) are the revenue base, accounting for more than 80% of sales in 2024.
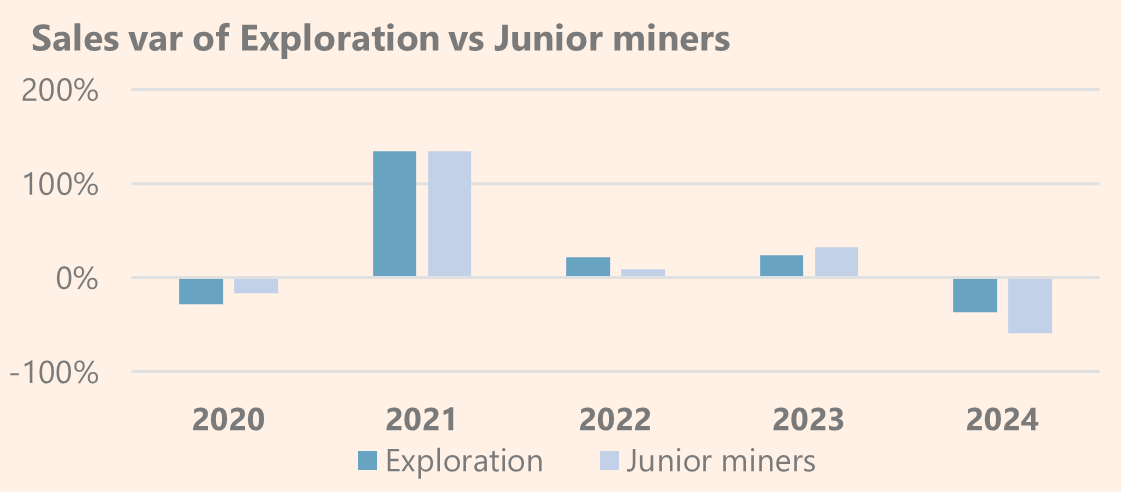
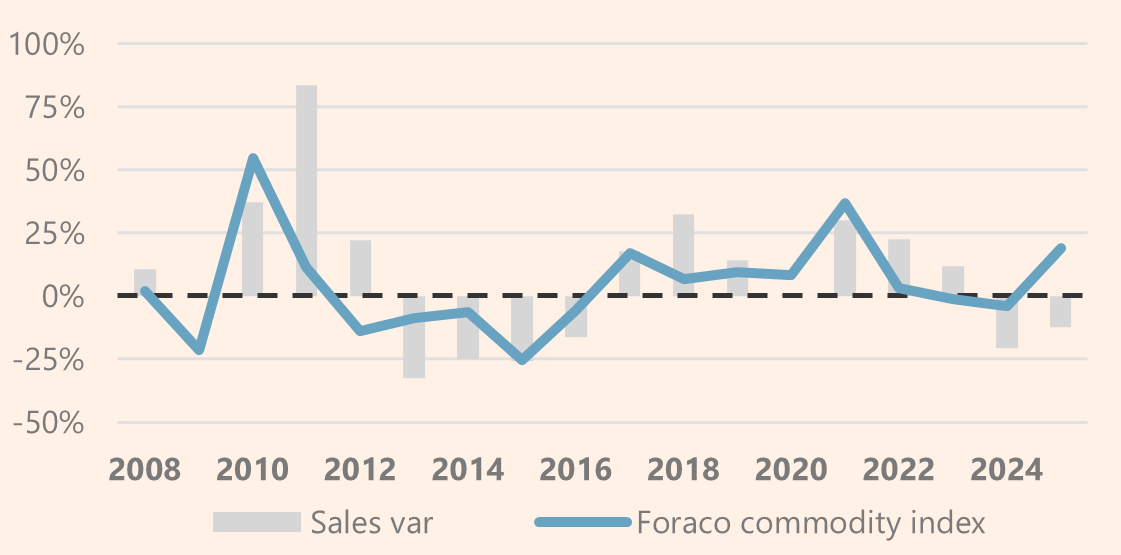
The link between Greenfield exploration appetite and junior clients is very tight, as shown in the chart below.
In other words, the appetite for mining wakes up the capital markets, which in turn decide to finance higher-risk junior projects that may or may not result in a viable mine.
Greenfield projects represent around 8% of Foraco’s sales, but when they grow, they are a powerful vector for sales growth, as they are just one element of a tsunami of Brownfield projects that precede them.
Minerals: The Drivers
The most important component in drilling demand fluctuations is client interest in exploring or intensifying the production of the main commodities to which Foraco is exposed.
For 2025e, the weights are as follows:
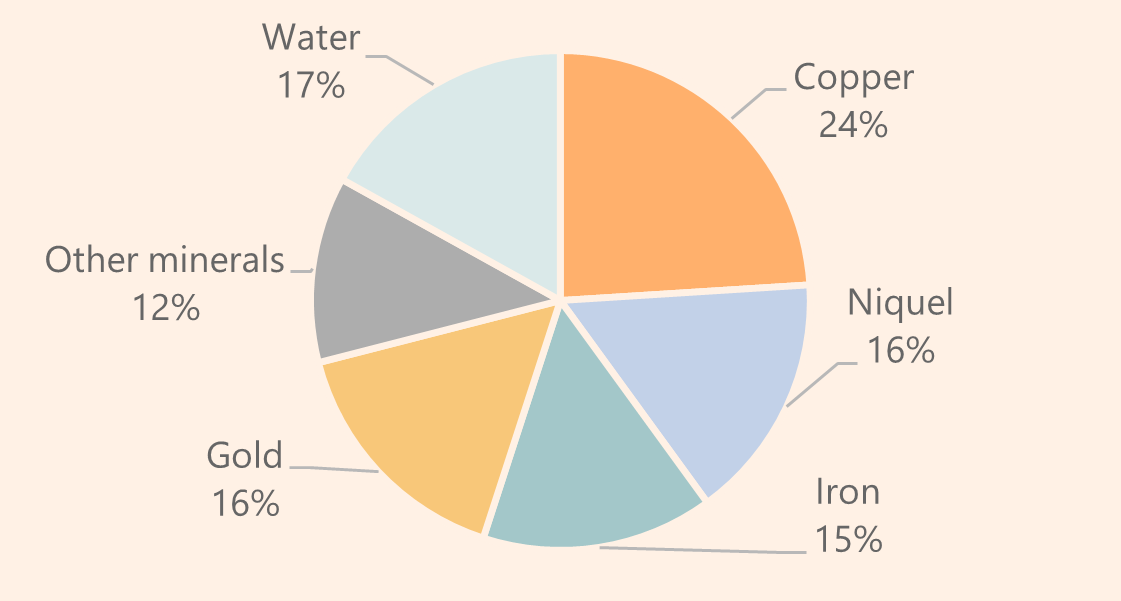
Price variations in these commodities—the ultimate indicator of supply/demand imbalance—drive or discourage Capex investment by Foraco's clients. In fact, by generating a synthetic index with commodity price variations (excluding water) weighted by their influence on sales, we can see current prices as a slightly leading indicator of company activity.
Each of these minerals exhibits varying degrees of scarcity, diverse end-uses, and distinct geographic production profiles. Consequently, they warrant an independent analysis of supply and demand fundamentals to assess the potential future demand for Foraco’s services.
In the following table, I have consolidated the supply and demand factors for each commodity, Foraco’s presence in the leading producing countries, and the suitability of Foraco’s services to the current needs of that specific commodity (for example, gold increasingly requires deeper and more technical drilling).
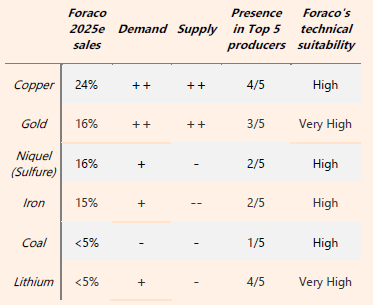
Due to its importance and weight within the thesis, i will focus mainly on two: Copper and Gold, which, together with Water, currently account for 60% of revenues. Why?
Foraco doesn't really care where the rig utilization comes from. The catalyst for profitability is a high utilization ratio, regardless of the source.
Gold and Copper are the pillar commodities of the thesis. Together, they account for 60-70% of the miners' exploration budgets.
(Note: At the end of the thesis, for the true freaks, I will leave a separate piece explaining Nickel, Iron, Lithium, and Coal).
As a compass for the Gold and Copper momentum, we will use the Capital Cycle, specifically illustrated in this clock.

“The Future” is fueled by Copper
Copper demand is expected to double by 2035, driven by green energy, EVs, and the data centers required for Artificial Intelligence.
This physical reality clashes with the needs of tech “hyperscalers,” creating a structural deficit in a metal that was already in deficit before this situation. Mining giants warn that the “new gold” is scarce, with key projects trapped in legal and cultural battles.
The Supply Squeeze: The supply deficit is imminent, and current copper ore grades are falling, forcing the processing of larger rock volumes. Price evolution clearly signals this imbalance: up 114% in 10 years (25% in the last year alone).
Wood Mackenzie notes that Brownfield expansions require 30-50% less Capex and come online faster than Greenfield projects. Given risk aversion and high capital costs, Majors are prioritizing these assets. These explorations are deeper and more technical—exactly where Foraco excels, obtaining superior margins . Foraco is present in all major producers except China.
The clock: Applying the commodity cycle clock, we are between Phase 4 and Phase 6, awaiting Phase 7 (new discoveries).
Phase 2/3 (Consolidation): Major copper miners have consolidated (BHP+OZ Minerals, Rio Tinto+Turquoise Hill).
Balance Sheets: Prices are rising, and balance sheets are healthy
Exploration: Budgets haven't spiked yet, but given the state of existing mines, it is inevitable
What are the miners saying?
Glencore: “Very exciting multi-decade brown and greenfield projects” “1 million tonnes a year by 2028”
BHP Group: “Pursuing more growth in world-class copper basins in South Australia and Chile”
Gold is the New (Old) Gold
Due to its scarcity, gold represents around 40-50% of the global exploration budget of major miners.
Its role as a store of value and a real asset backing central bank balance sheets is driving demand in a world of economic blocs, debt, inflation, and negative real rates.
The Supply Problem: Supply growth is completely stagnant. Existing mines are aging, and large discoveries are rare. Majors are acquiring Juniors with existing projects due to the high cost of exploration. Financing for new ventures has been halted by the cost of capital.
Despite a 76% growth in the last year (270% in 10 years), banks like JP Morgan or Goldman Sachs see gold above $5,000/oz. These sustained high prices will eventually justify exploration and trickle down to Foraco. As surface deposits are depleted, deep diamond drilling (Foraco’s specialty) is required.
The clock: We are in the same phase as copper (4 to 6).
Mega-mergers have occurred (Barrick+Anglogold, Newmont+Newcrest).
Balance sheets are solid.
Exploration budgets began to signal a slight trend change in H2 2025.

What are the miners saying?
Agnico Eagle: “Most ambitious exploration program we’ve ever had”
Anglo Gold: “Assign a total of $50 million, an additional $15 million a year to exploration”
The Drilling industry
The drilling sector is highly fragmented, with only ~25% of the market in the hands of global companies. The main competitors with multi-country scale are:
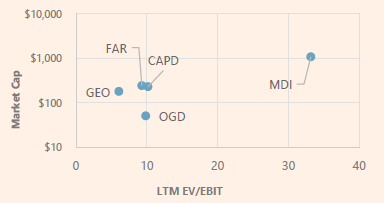
Major Drilling (TSX:MDI): Global reference. High specialization in copper/gold. Roughly double Foraco’s size .
Capital Limited (LSE:CAPD): Strong in emerging markets (Africa/Middle East). Divergent strategy: offers integrated mine services (earthmoving, labs) .
Orbit Garant (TSX:OGD): Half Foraco’s size. Canada/Chile focus. >60% Gold exposure .
Geodrill (TSX:GEO): Technical competitor highly dependent on Gold (85%), focused on Africa, expanding into South America.
Foraco is #3 by size (or #2 excluding Capital Limited’s integrated services). It has a key differentiator: The Water Segment, which provides stability.
Major miners rely on Foraco and the top players for technical projects due to compliance and safety, whereas they might hire a local competitor for price on a simple job.
Furthermore, there is a whole ecosystem of small local family businesses in the most developed mining economies (Canada, USA, Australia...). However, in less developed economies, small local players cannot compete technically with the major ones on complex projects.
Regarding local competitors, major miners rely on Foraco and the top players due to their size and compliance standards, which provide security and service stability throughout the mine’s life and across different geographies. Conversely, they might hire a local competitor purely on price for a simple exploration task or low-technical work.
The highlight: Foraco operates with greater metal diversification than Orbit, Geodrill, or Capital Limited, and has a more diversified geographic presence, focused mainly on stable jurisdictions.
The Crash That Left a Scar (2012-2016)
The sector went through a deep crisis starting in 2012: revenue collapse, junior bankruptcies, and exploration budgets vanishing.
Companies had been very reactive to the boom years, with high Capex/M&A, but since then, they have prioritized capital returns over investments.
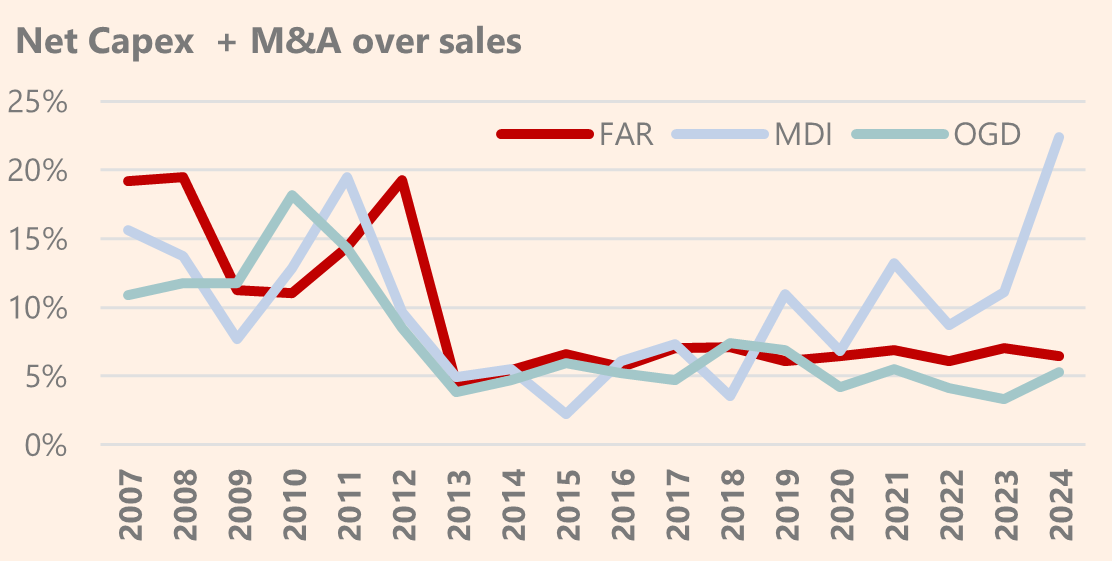
For Foraco, this led to a debt restructuring by Oaktree and a “deep winter” in its share price. Only Major Drilling, due to its size, has managed to reverse the underinvestment trend prioritizing small acquisitions in the last years.
In 2025, there are roughly the same number of drilling rigs available as in 2016. It is not easy to increase supply quickly even if appetite wakes up.
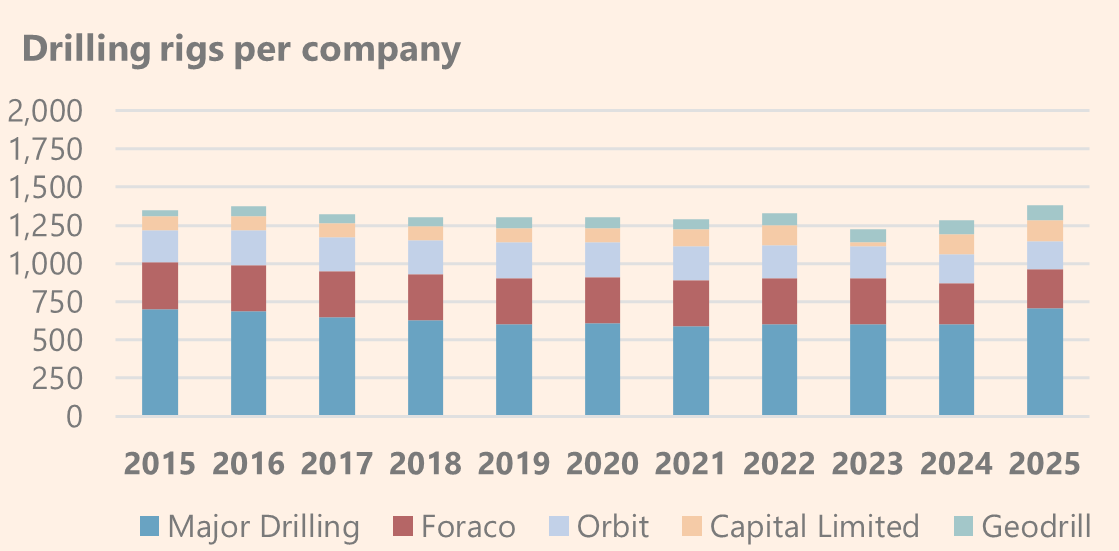
Companies have underinvested for years~~ with small fleet renovations and timid M&A (by Major Drilling) that has not increased available capacity, only reordered it.
The result of a more disciplined sector and the memory of the crisis is visible in margin evolution.
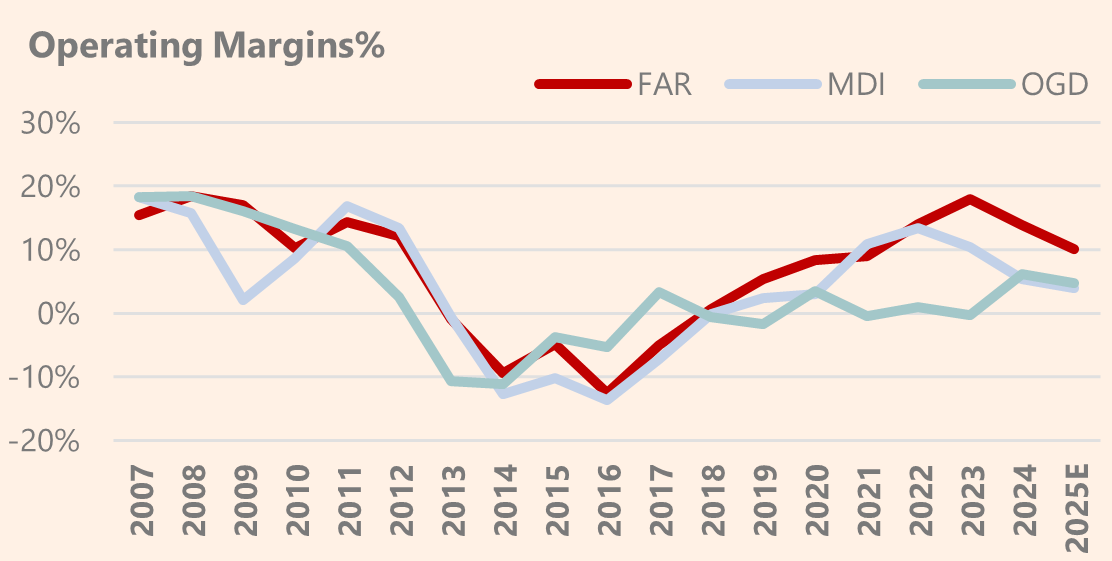
Highlight: The sector represented by these main players is not in overcapacity and could experience an equipment shortage if gold and copper expectations are met. Capital discipline makes them reluctant to invest heavily .
Internal Analysis
So far, we have established how diverse macro factors and commodity cycle dynamics are converging positively for Foraco's clients. Crucially, this coincides with an optimal period of supply scarcity and capital discipline among drilling companies.
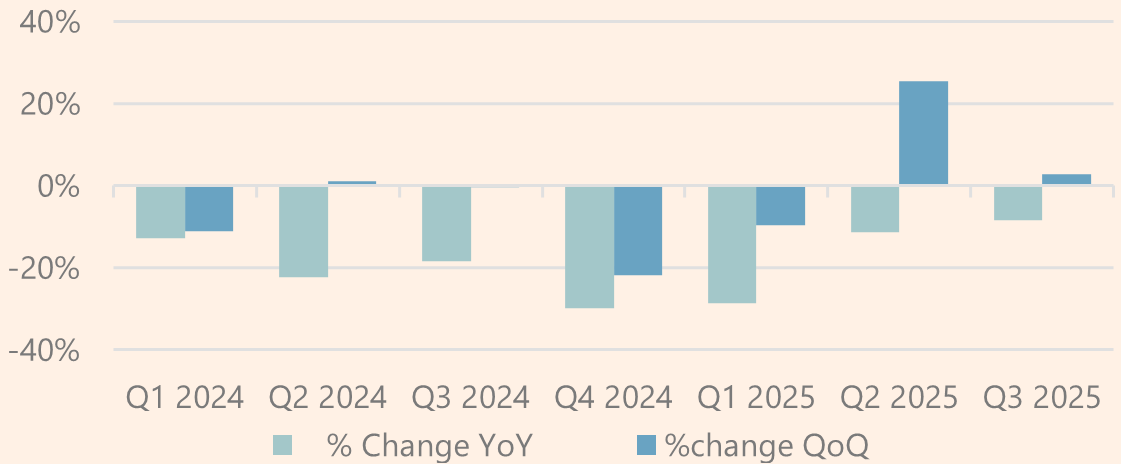
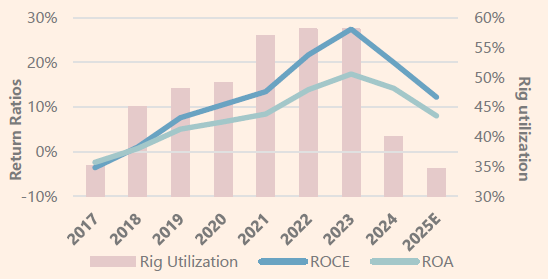
Now, let's examine the internal factors to assess Foraco's ability to capture this growth potential. We start with the 2024 and 2025 results, because this sector is highly volatile, and we are coming off two years of double-digit declines.
2024: Junior Collapse
Foraco's year was defined by the weakness of junior clients, with a 60% drop in sales from the 2023 peak (where this client type reached $70 million). The difficulty in accessing financing was the key factor.
According to S&P Global Market Intelligence, the share of Junior companies in the global exploration budget fell in 2024 to its lowest level in decades. While Majors increased spending to secure reserves (Brownfield), capital allocated to Juniors contracted by nearly 13% YoY.
Additional headwinds included the strength of the US Dollar against key operating currencies (CAD, CLP) and the strategic exit from Russia.
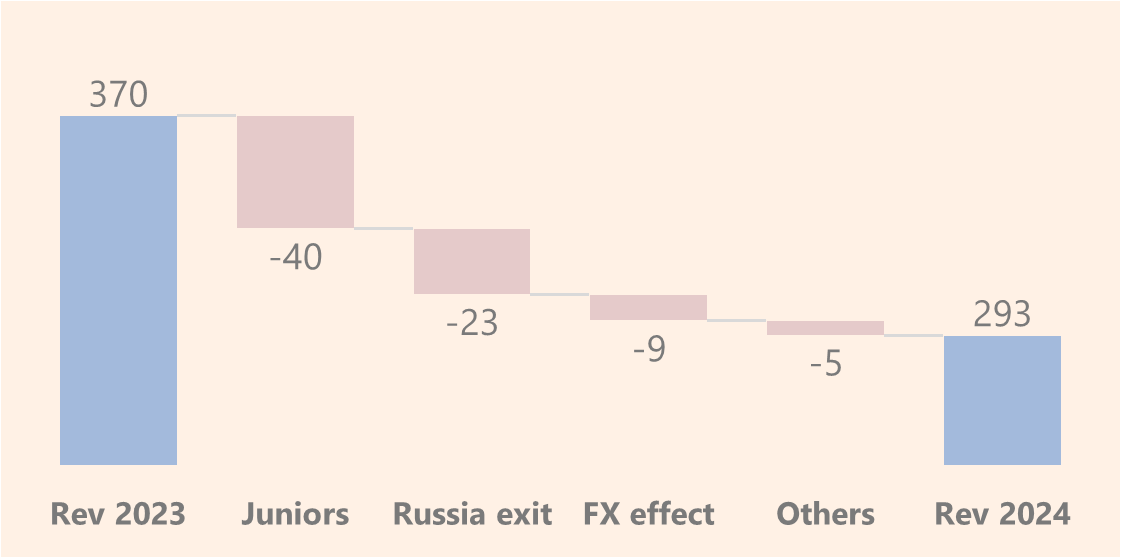
Excluding currency effects and the portfolio impact (Russia), the revenue drop in 2024 moderates to 12%, with the Junior pullback accounting for the bulk of it (10%). For context, competitors like Major Drilling reported a 15% sales decline primarily due to this same effect.
2025: Signals of bottom
The first 9 months show a 16% drop in sales (12% adjusted for FX & portfolio), with significant weakness in North America and Canada (-27%). Looking at key competitors, we see a mixed picture that requires nuance:
Major Drilling: Reported a +24% progression in its H1 2026 (April-Sept), with >100% growth in South America. However, this is a mirage due to an acquisition; on a like-for-like basis, they show declines of 2-4%.
Orbit Garant: In its Q1 2026 (June-Sept), reported a 3.7% drop, impacted by temporary client delays and the gradual ramp-up of new projects—circumstances mirroring Foraco's situation.
Returning to Foraco, the instability caused by tariffs—which delayed or blocked new investments—was compounded by project completions and a management decision not to enter price wars, betting instead on technical work. Management specifically highlighted a strategic rotation from Nickel to Gold.
In the last two quarters, we have seen a moderation in YoY declines and a reversal in the last two, with positive QoQ variations. (Q2 is exacerbated by stationality effect, but look at Q2 2024).
Turning points: New projects & Junior Green Shoots
During the second half of the year, the company announced the signing of three major contracts, mainly in North America and Chile, with Tier 1 miners for Brownfield projects. These projects have an average duration of 3 years and amount to approximately $240 million. Key among them is a gold project in Nevada, USA.
The last comparable milestone dates back to 2023, for a Water project with Rio Tinto in Australia.
Regarding Junior demand, management began seeing signs of recovery starting in Q2, reaffirmed in Q3 by the reactivation of financing. Competitors share this view.
According to S&P Global, through October, total financing for the mining sector increased 93% YoY:
Gold: +136%
Rest of Metals (led by Copper): +31%
Exploration: This momentum extends even to Greenfield, which rose 27% QoQ and 5% YoY.
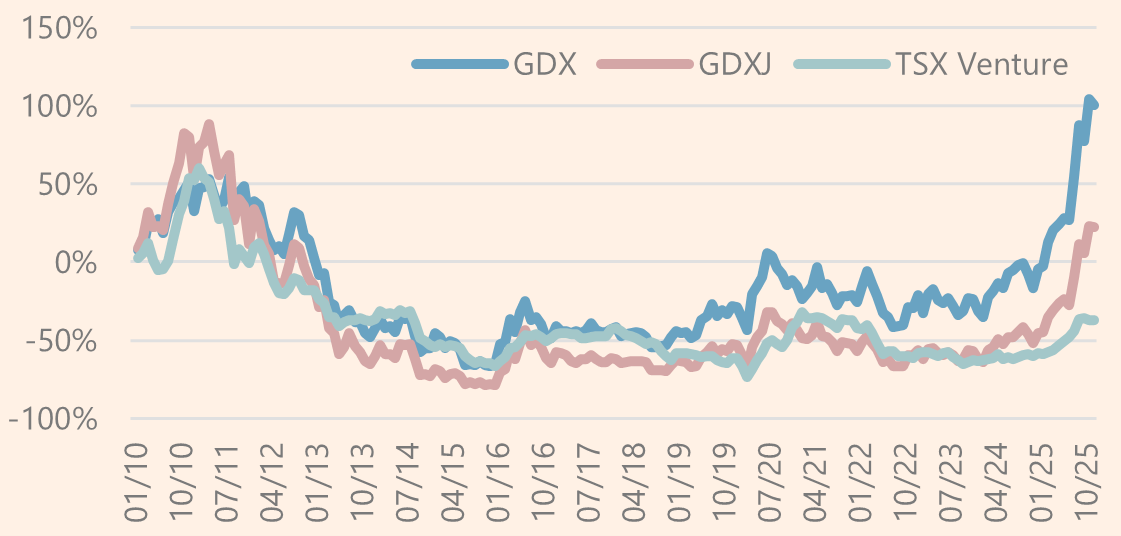
The financing trough and the renewed (albeit incipient) momentum can be clearly seen in the TSX Venture Index (dominated by natural resource explorers) and the VanEck Junior Gold Miners ETF (GDXJ) relative to its large-cap sibling.
The Materialization of the Imbalance
Revenues
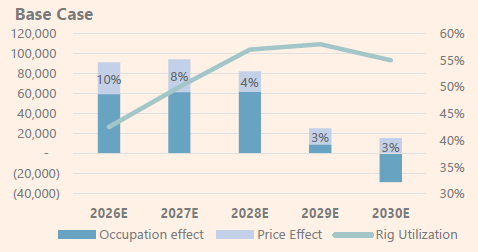
Following the commodity analysis, two scenarios for annualized sales growth are presented. The base case, considered the most likely, is a position of cautious optimism that reflects the supply-demand imbalances in commodities and the supply-side factors within the drillers. The low case accounts for a slowdown caused by a potential recession, moderating growth without ignoring the major imbalances that will eventually have to be addressed.
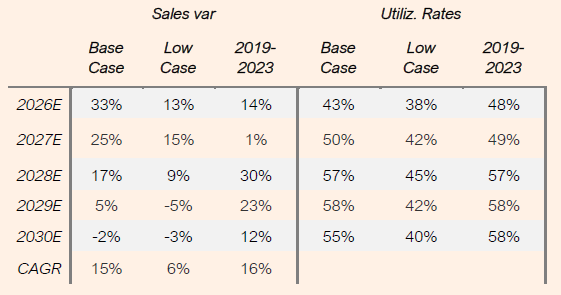
The result of combining these projections is a 15% CAGR (annualized) for the base case and nearly 6% for the low case. While the base case may seem ambitious in terms of revenue given recent years, there are strong reasons to project these numbers.
This sector is characterized by explosive growth: when demand for services arrives, rig rotation multiplies and sales skyrocket. In 2021, they saw 15% growth, followed by 36% in 2022 and 11% in 2023. As we have seen, there are reasons to state that current supply and demand imbalances are more solid than back then, and the sector is in a better position.
At that same point, price ceases to be a selling point, and the sense of urgency allows for margin expansion. As previously noted, the number of rigs among the main competitors has not grown in the last 10 years. Revenue per rig has increased by about 14% annually since 2020, but this indicator is also influenced by asset turnover, measured by the utilization rate.
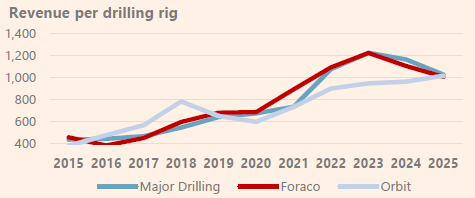
With the available data on rig utilization, we can estimate the maximum revenue (at 100% occupancy) per rig as a method of isolating the price effect from the utilization effect. While not a perfect indicator—given the mix of more or less complex jobs—we can see a clear trend: between 2017 and 2020, Major Drilling and Foraco were able to increase prices by 3% annualized, whereas between 2020 and 2024, they increased them by 14% to 18%.
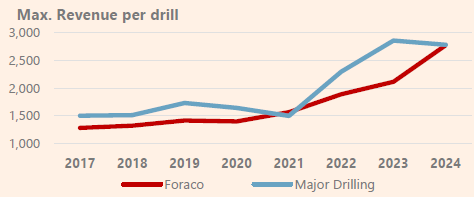
From this, we can conclude that between 2021 and 2022, they were able to pass on cost increases to their customers and increase margins in a medium-high utilization scenario (50-60%). In the base case, the primary driver of sales is the increase in occupancy, supported by price increases above inflation during growth years.
Margins
Approximately 90% of Foraco's expenses are directly attributable to sales (COGS), mainly direct labor (operators), consumables, and machinery depreciation. It is a business with high operating leverage, where the equipment utilization rate—measured as rig utilization or fixed asset turnover—is of paramount importance to the bottom line.
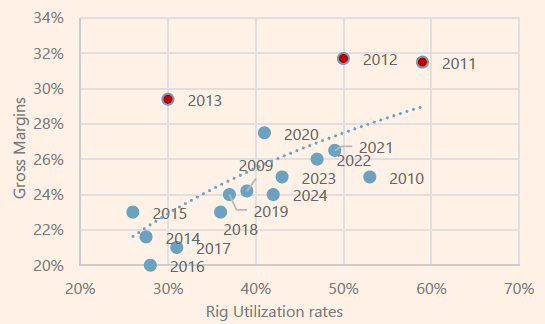
Increases in rig utilization boost the gross margin, following a curve of diminishing returns: beyond a certain level of activity, hiring additional personnel to cover extra shifts can become too expensive (due to training costs, labor shortages, etc.) and/or expose the machinery to over-activity, which could lead to more frequent breakdowns.
In other words, at a 30% utilization rate, a 1% increase results in a 60 basis point expansion of the gross margin due to better absorption of fixed costs. However, above 60% utilization, the same occupancy increase only impacts the margin by 27 basis points.
To estimate the diminishing returns curve of the gross margin as optimal equipment utilization is reached, we have used observations from its main competitor, Major Drilling, for which we were able to obtain utilization rates and gross margins over a long observation period.
These observations are considered relevant given the comparative gross margins between both companies, with the exception of the deep crisis period Foraco experienced between 2010 and 2017, marked by restructurings, layoffs, and low occupancy.
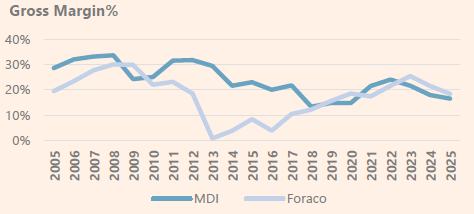
The visualization of the gross margin and utilization rate plot shows the diminishing returns regression model that we will use to model the gross margin, excluding the three outliers in red from the peak of the previous cycle.
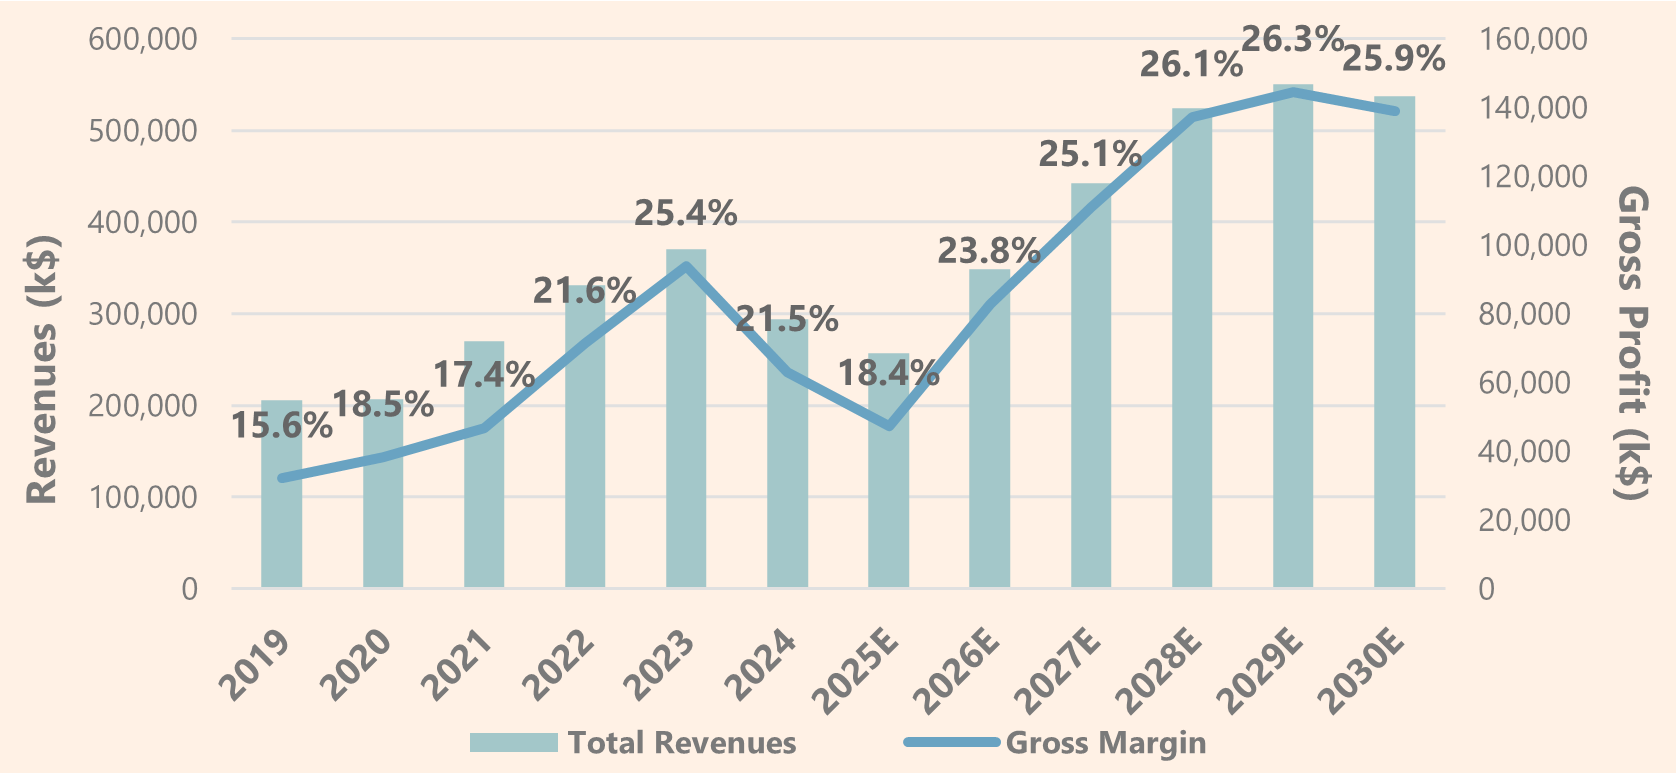
The combination of the base case with the margin modeling shows that Foraco could exceed $500 million in revenue, with margins surpassing 26% at the peak of the cycle.
As I anticipated, 90% of the costs are COGS, while the remainder consists of fairly predictable and stable SG&A expenses and financial debt costs. I will elaborate on the financial debt in the ‘The Deep End’ appendix following the conclusions.
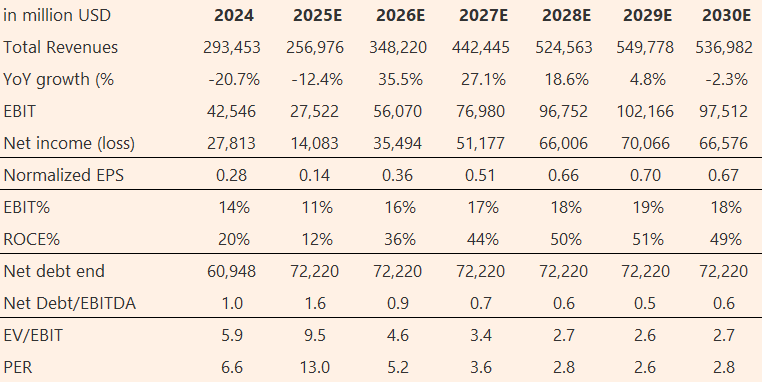
The summary of the projections of key financial indicators is as follows:
Valuation
The valuation was conducted using a P/E multiple of 8x, reflecting the risk of non-materialization due to its status as a small-cap, the aforementioned sector disaffection, or the possibility that mining exploration expectations do not fully permeate this industry.
Furthermore, as this is a cyclical industry, the price target is determined by the year representing the mid-cycle, which in this case is 2027.
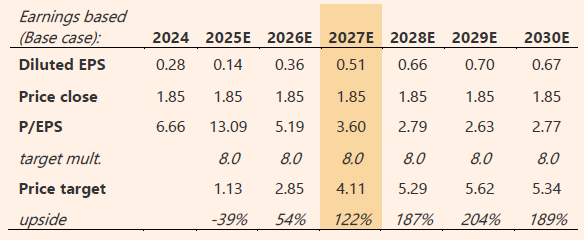
The valuation shows a 120% upside in the base case and a low-case scenario with a reasonable margin of safety.
Let’s discuss the non-materialization risk, which justifies the low multiple and the choice of 2027 as the mid-cycle point.
Non-materialization risk
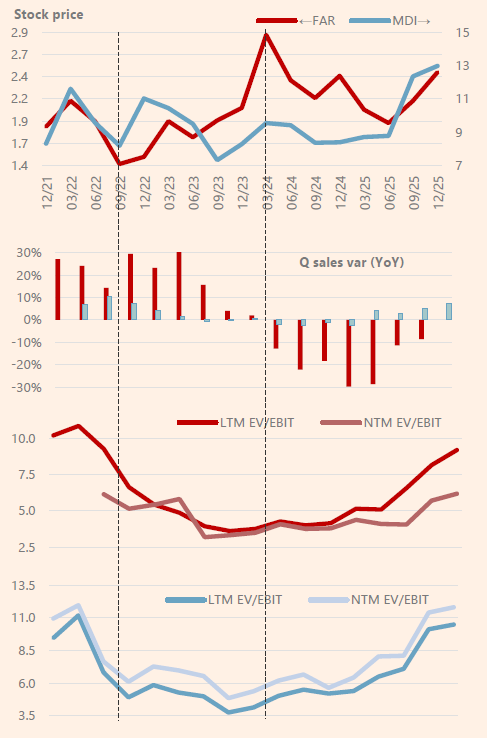
In the mining environment of 2019, which extended through the bottlenecks until mid-2023, the stock price was dictated by Major Drilling’s negative results, which anticipated a short cycle.
The market did not reward Foraco with a multiple expansion based on expectations; it was ultimately the real earnings that drove the share price, peaking at CA$2.87 with an EV/EBIT of only 4.3x. This was further compounded by the lack of interest in the sector and Foraco’s market capitalization level.
If institutional capital does not flow into small caps within the sector, earnings may arrive too late in the cycle, potentially signaling a final phase that prevents extracting the full investment potential from Foraco.
Based on an EV/EBIT multiple of 4.5x at the peak of the cycle, the base case maintains a margin of safety with an 80% upside.
The non-materialization risk of the thesis is also intrinsically linked to the next one: liquidity risk.
Liquidity risk
As we have discussed in our sector analysis, drilling is an industry overlooked by capital markets. Foraco is illiquid. Monthly trading volume in recent months rarely exceeds $5 million, making it uninvestable for large funds.
The trading volume of Major Drilling, the sector benchmark by size, is approximately five times higher, despite still being low. Its free float stands at 99%, compared to Foraco’s 60%.
Major Drilling trades at a significant premium, as it is the only player exceeding $1 billion in market cap. We can infer that a large portion of the sector’s NTM (Next Twelve Months) expectations has been channeled through them. Over the last year, they have moved from trading at 11x LTM (Last Twelve Months) EV/EBIT to over 30x, reflecting growth expectations with an NTM EV/EBIT of 12x
Conclusion
The thesis—rooted in the supply-demand imbalances of key commodities, the current phase of the mining cycle, and the dynamics of the drilling industry itself—provides a very solid foundation for a sector-wide recovery.
Internal factors also remain favorable: low leverage, significant insider ownership, investment discipline, and a clear focus on profitability. This is further bolstered by the recovery in activity, highlighted by three major drilling contracts secured for 2026.
The valuation has been conducted conservatively, yet it still demonstrates a sufficient margin of safety. While liquidity risk remains a significant hurdle, that is simply part of the game.
Thanks for reading, don’t forget to subscribe and comment
Extra: The Deep End
Other metals
Niquel (16% 2025e sales)
Nickel demand is primarily driven by the stainless steel industry (~70%), high-performance batteries—including those for premium EVs—(~15%), and special alloys (~10%) used in aerospace.
Despite having a single price index, nickel falls into two classes based on quality:
Nickel Laterite (”Dirty”): Extracted from open-pit mines using earthmoving techniques. Foraco does not operate here.
Nickel Sulphide (”Green”): Extracted from deeper underground mines. This is Foraco’s terrain.
Laterite nickel, found in low concentrations in soil, was historically expensive to process until Chinese investment flooded Indonesia. The result speaks for itself: In 2015, Indonesia produced less than 10% of the world’s nickel; today, it accounts for almost 60%.
The supply surge from Indonesian laterites has fundamentally altered price dynamics, as shown in the chart.
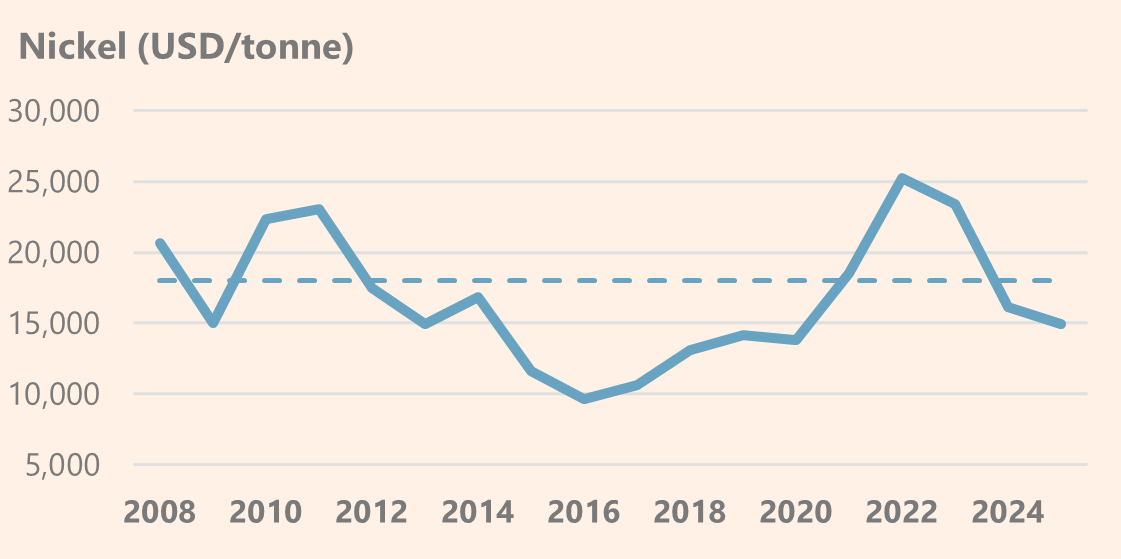
Although current nickel prices depress general exploration appetite, it is crucial to distinguish between the two underlying markets. Indonesia’s massive supply requires energy-intensive chemical processing to reach battery-grade purity. This generates a carbon footprint incompatible with Western ESG standards and government subsidies (like the US Inflation Reduction Act).
Therefore, the Western supply chain maintains a strategic need to secure “Green” Nickel. This requires deep technical drilling, which effectively decouples Foraco’s activity from the global spot price and sustains demand in key jurisdictions like Canada and Australia.
Iron (15% 2025e sales)
The iron market is transitioning from a volume-based model driven by construction to a quality-based one focused on decarbonization. Although global supply is abundant, the specific need for high-purity ore for “Green Steel” production sustains activity.
Iron does not offer the explosive growth potential of copper exploration, but it provides “Grade Control” contracts. These are long-term agreements that act as defensive and recurring cash flows, vital for amortizing fixed costs.
Iron mining requires significant production drilling (Grade Control) rather than wildcat exploration. It is a constant, high-volume workflow, ideal for securing long-term visibility, albeit with tighter margins than gold.
Lithium (<5% 2025e sales)
The lithium market is maturing, shifting from an exploration frenzy to a phase of selective industrial development. Short-term price volatility has cleared the market of speculative juniors, concentrating capital into quality projects within safe jurisdictions.
Lithium offers valuable technical diversification. It combines traditional hard rock exploration drilling with water management and deep well contracts for brines—a niche with high technical entry barriers.
Furthermore, to reduce geopolitical dependence on China for these materials, the United States and Canada are projecting significant capacity increases in the coming years.
Coal (<5% 2025e sales)
Coal acts as the counter-cyclical anchor and defensive cash flow generator. The structural lack of investment in new projects (driven by global ESG restrictions) compels producers to maximize reserves at operating mines through extension drilling and intensive grade control.
As a “pariah” sector for many competitors, Foraco benefits from a less saturated competitive landscape. This allows the company to secure stable and profitable volume contracts, underpinned specifically by the currently irreplaceable demand for metallurgical coal for the steel industry.
Ownership
Slightly more than 30% of the company is controlled by the holdings of the two founding families, with significant insider weight. The rest of the shareholding is widely dispersed and does not hold positions from relevant financial entities.
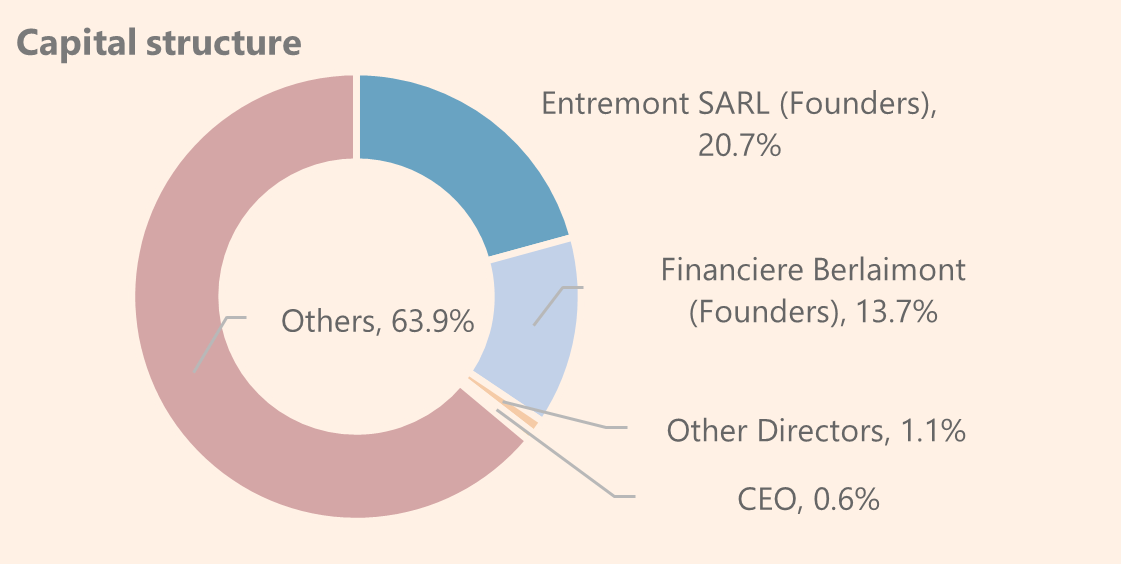
In 2023, the original founders gave way to a second generation that remains removed from daily management, relying on external executives.
Tim Brenner has been the CEO since 2023; he was previously Director of Foraco Canada since 2006. His prior experience is also in the sector at Boart Longyear.
Debt & Cost of Capital
Foraco has turned the page on the distress period of 2013-2016, which forced a costly debt restructuring. However, the balance sheet still carries the weight of that legacy. Current gross debt stands at $80 million, with maturities spread between 2026 and 2028. Crucially, half of this principal matures in 2028, with an embedded option to extend for an additional six years.
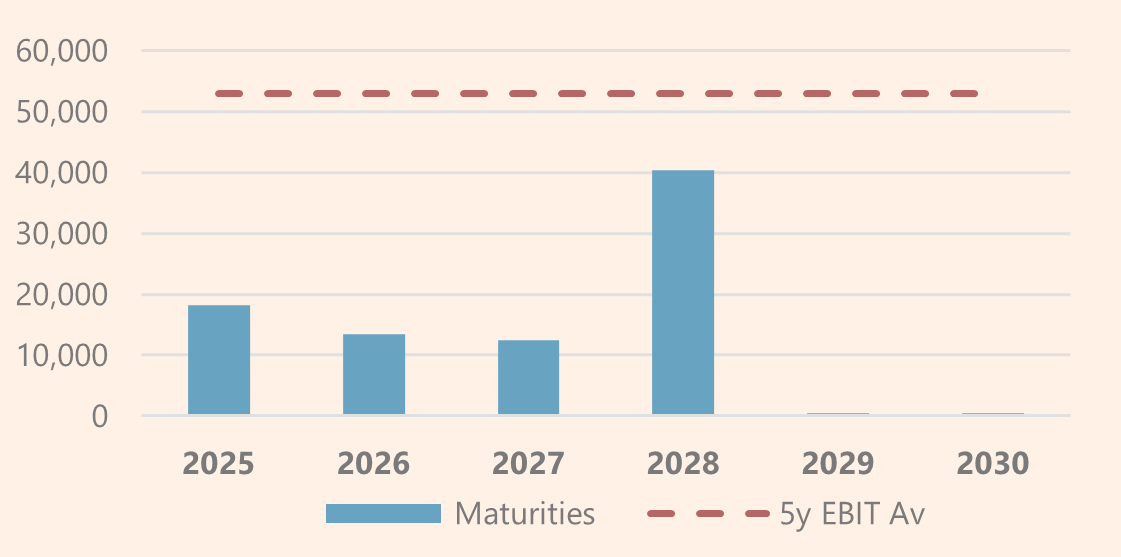
The risk isn't solvency (the maturity profile is manageable), but efficiency. Foraco bears a heavy cost of debt between 9% and 10%. In stark contrast, its main competitor, Major Drilling, operates with a Net Cash position and a cost of debt in the 5-6% range.
Working Capital
The drilling business is working capital intensive, primarily driven by client financing. The cash cycle presents a structural mismatch: outflows to suppliers (for fuel and consumables) occur much faster than inflows from major miners, who dictate payment terms. While client advances occur occasionally, they are negligible.
Working capital requirements are highly cyclical.
Low Activity: Requirements can spike to 25% of sales.
High Activity: Requirements compress to 15%.
Why? In peak demand phases, Foraco gains bargaining power—particularly over junior miners—allowing them to demand better terms, such as upfront payments.
Credit risk is ostensibly low, but the 2024 numbers demand attention. At year-end, Foraco reported $10 million in past-due receivables that were not impaired.
As stated in the Annual Report: “These relate to a number of customers for whom there is no recent history of default or with established practices of long payment terms.”
While management cites “standard practice,” the magnitude is notorious:
This amount represents 30% of total receivables in 2024 (a historically high figure).
It equates to 4% of revenue (up from 2% in 2023).
2025 9M financial statements do not indicate this has been resolved; in fact, the total receivables balance has increased. This is a metric to watch closely.
DISCLAIMER: All the information provided in this document is purely informative and does not constitute a buying recommendation (according to Spanish Law Article 63 of Law 24/1988, of July 28, on the Stock Market Regulator, and Article 5.1 of Royal Decree 217/2008, of February 15). DuckPond Value Research is not responsible for the use of this information. Before investing in a real account, it is necessary to have the appropriate training or delegate the task to a duly authorized professional.
Reach us on duckpond@duckpondvr.com