


Welcome to The Pond Journal #6. Starting next week, we will begin a wave of corporate earnings releases from the companies we follow at The Value Pond, extending practically through March.
I will be commenting on the results for WizzAir, Forvia, TGS, Foraco, American Axle, and Bayer on X, and if anything of vital importance arises, I may cover it more extensively in a future Journal.
But before that, let’s revisit Pond Journal #1, written back in October. At that time, we discussed gold, and I stated the following:
"Gold is at an all-time high against our beloved fiat currencies, but not against real assets like housing or other commodities. There is no bubble here; only a paradigm shift."
Since then, gold has climbed an additional 20%, and research firms like Goldman Sachs are already raising their price targets to $5,500.
Geopolitical tensions, central bank demand, and a complete lack of faith in any government balancing its books without debt-based stimulus are sufficient drivers for gold demand. This remains true whether we see a 10% correction tomorrow or if the price reaches that $5,500 mark.
Miners of Gold
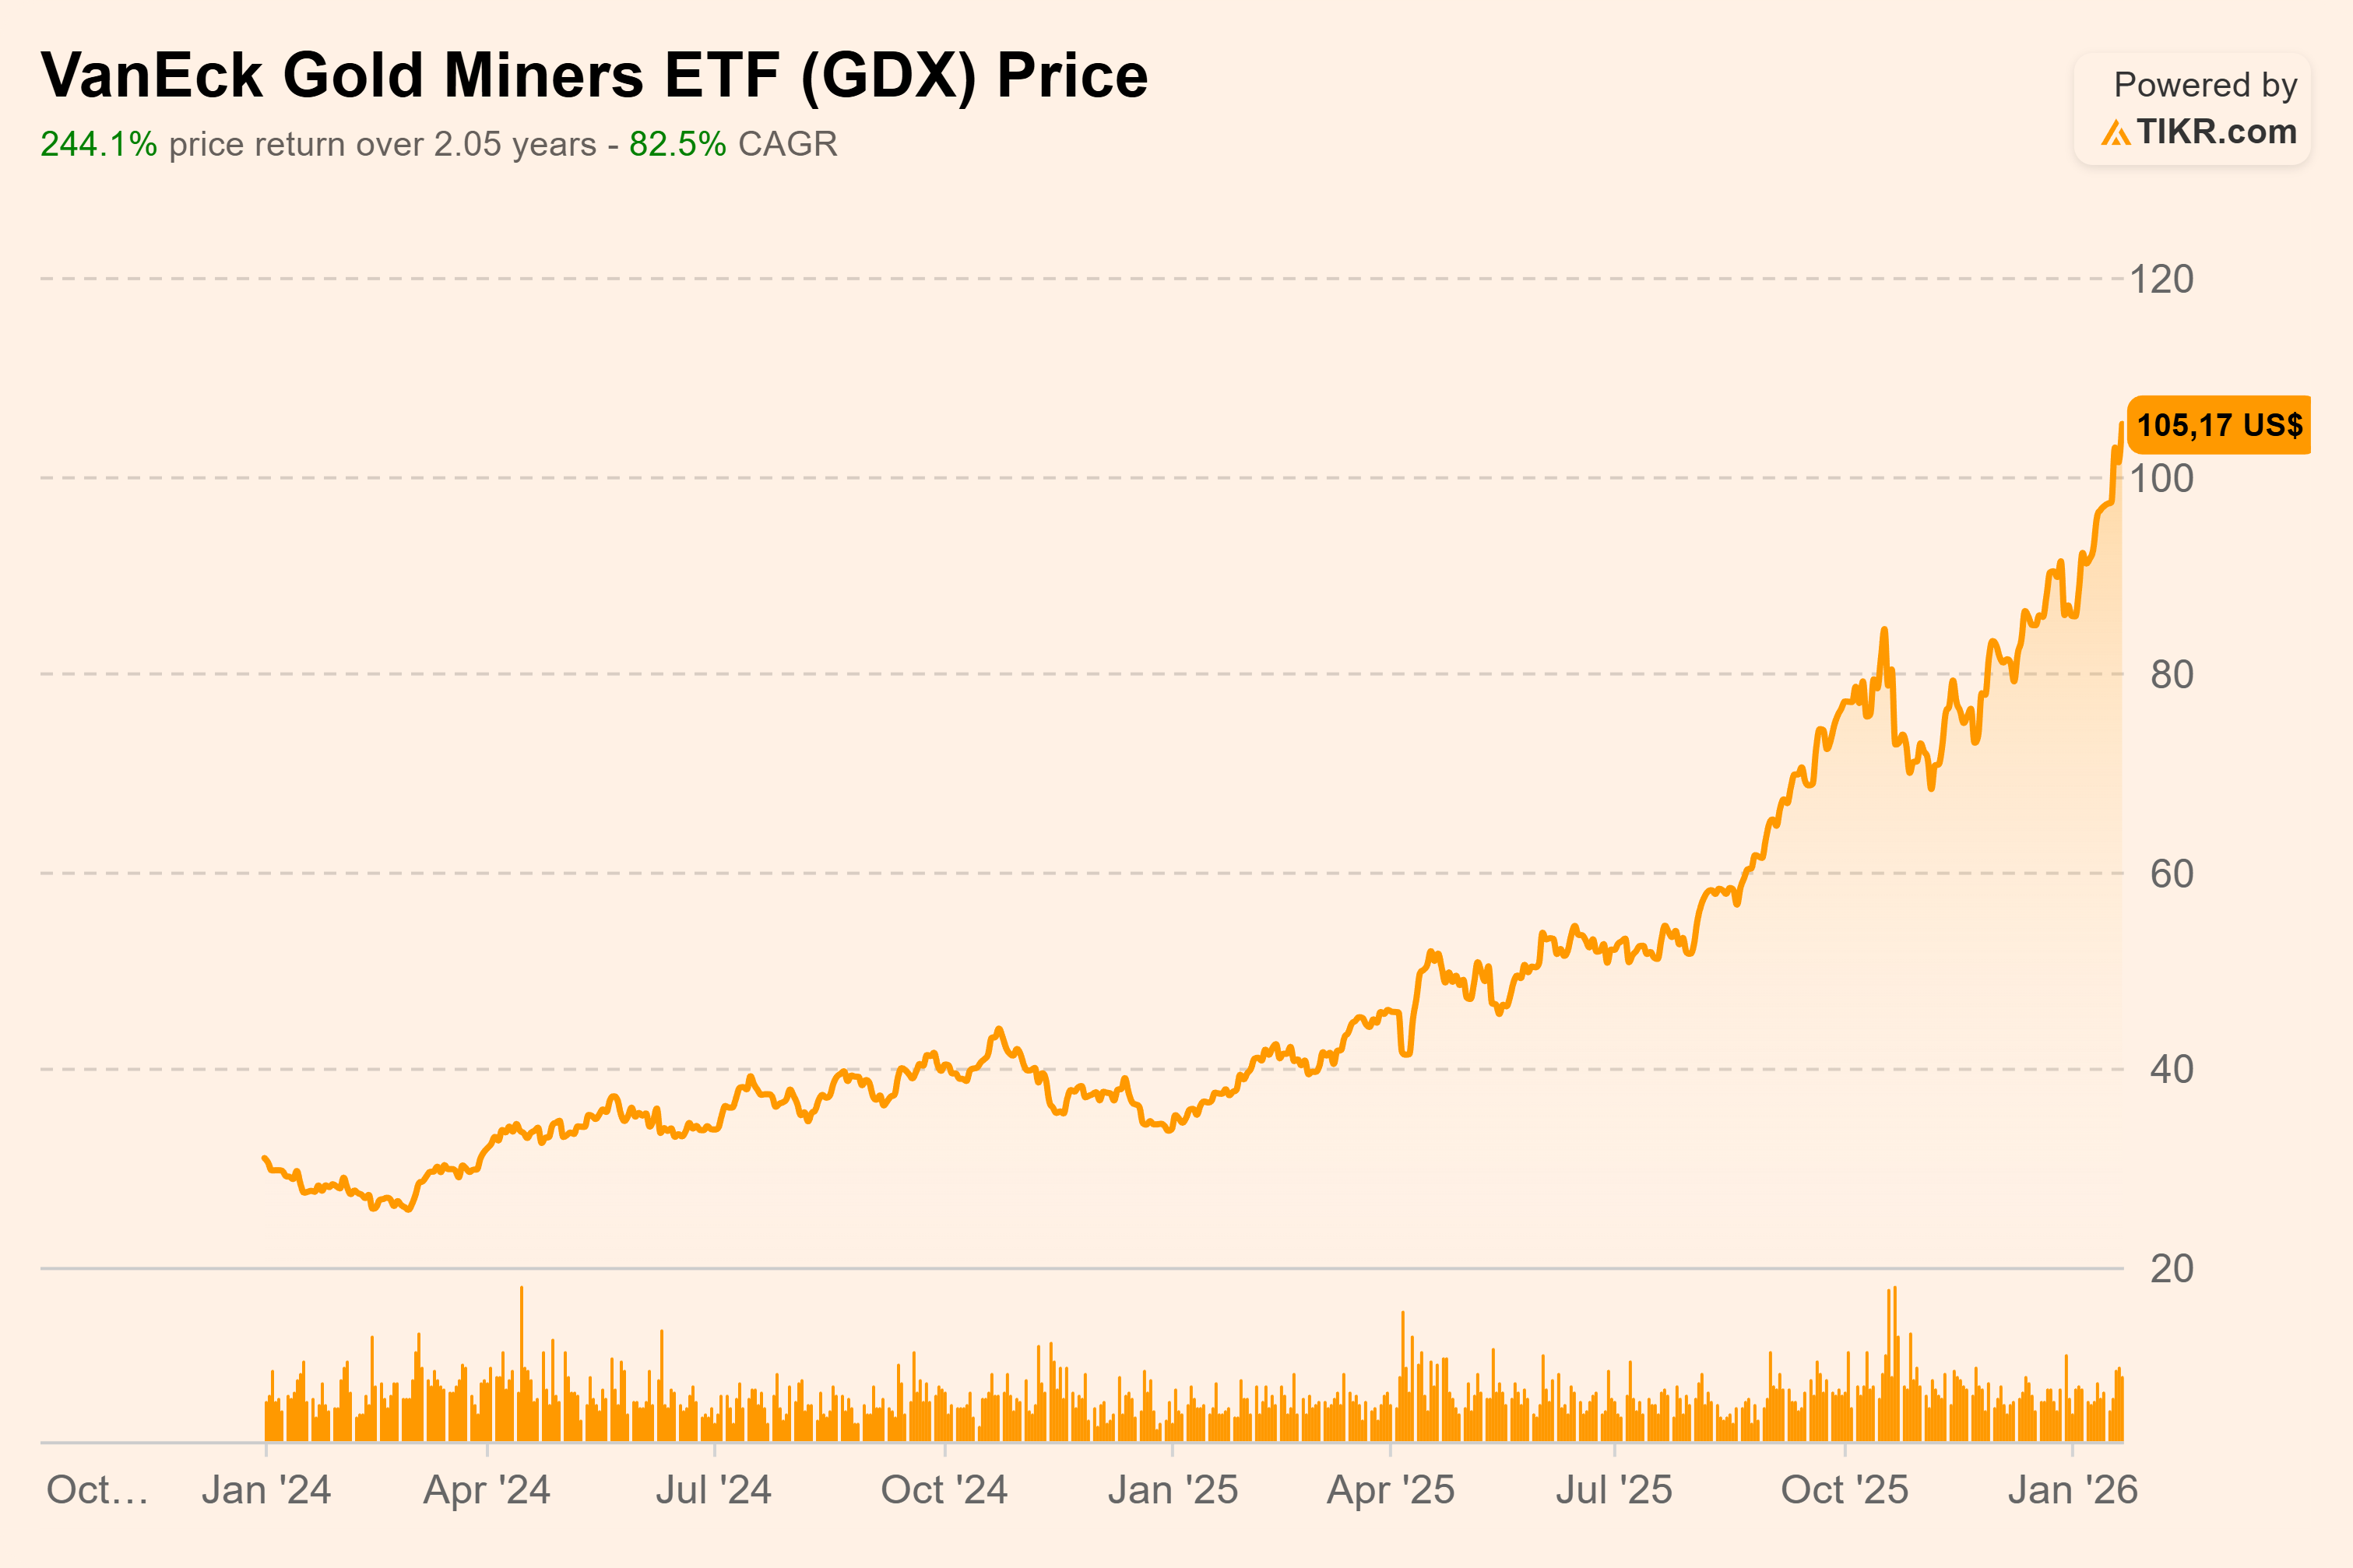
One of the most lucrative ways to gain exposure to gold in 2025 has been investing in miners—for instance, through the VanEck Gold Miners ETF (GDX), which represents the top forty global gold mining companies by market cap. With a 180% return in one year, it has been even more profitable than investing directly in the metal.
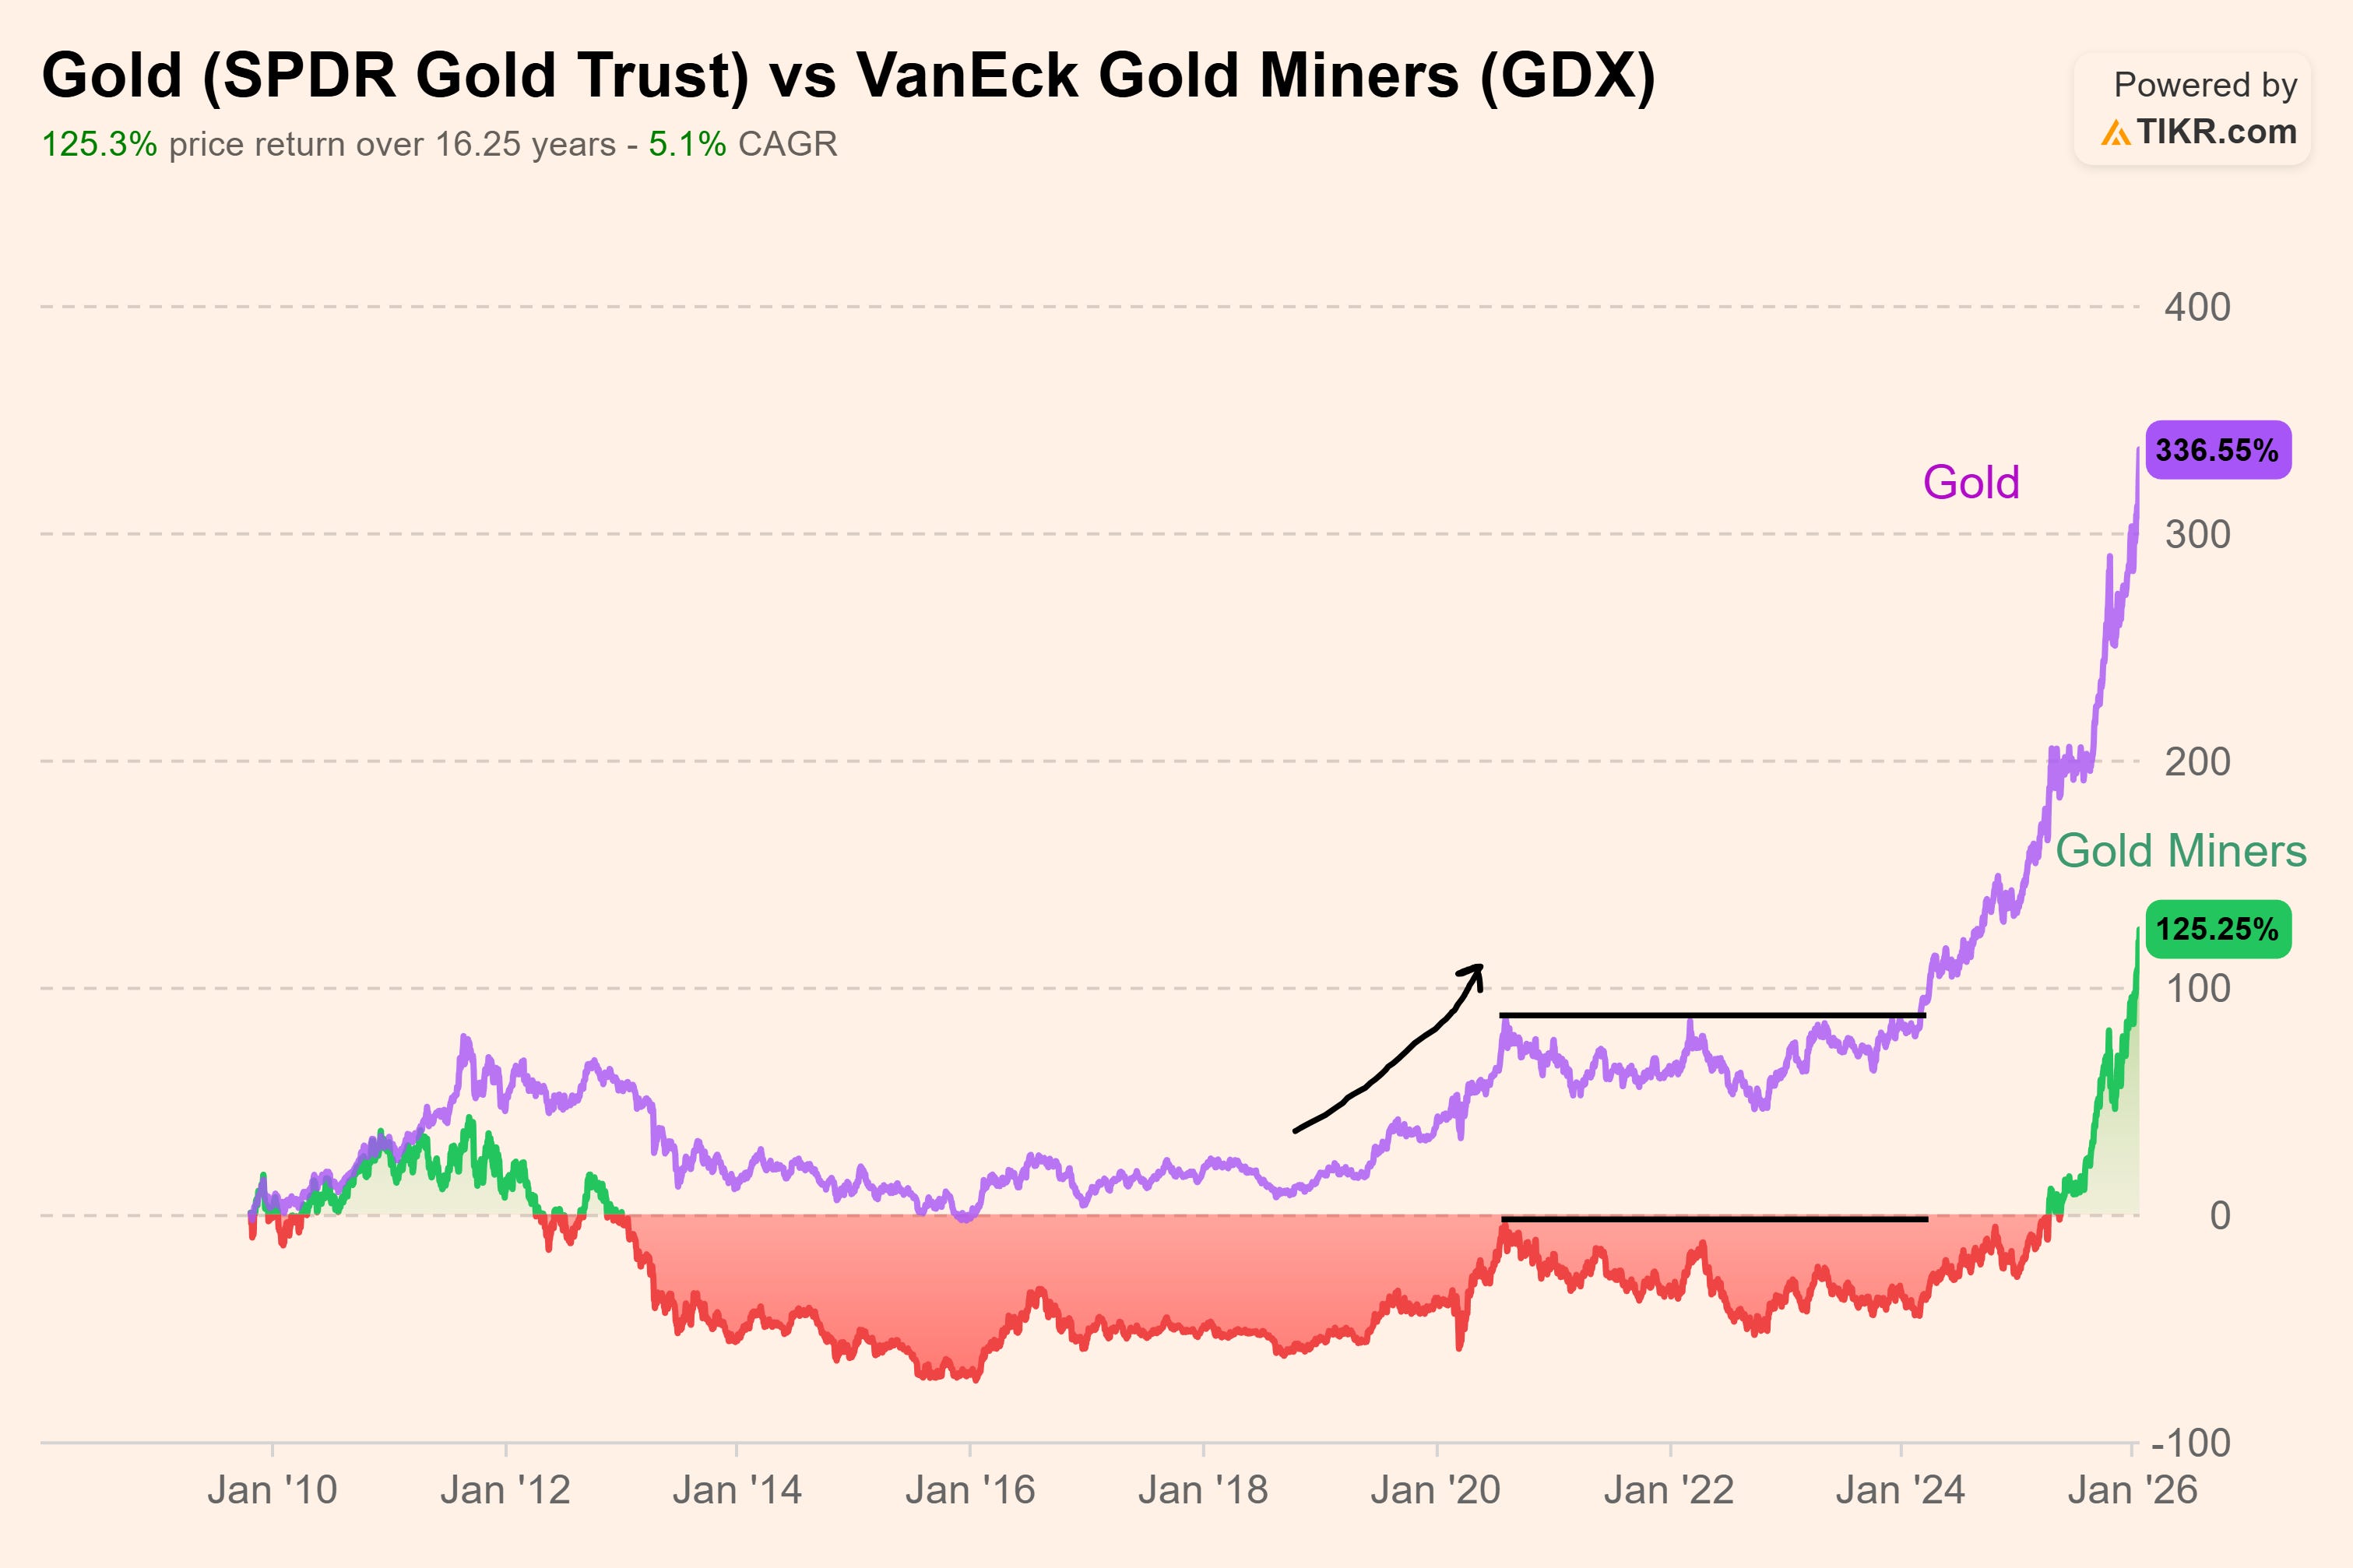
However, this hasn't always been the case. Following the peak of the previous cycle (2011-2012), miners went through a profound crisis that forced a sector-wide restructuring and consolidation. This process generated deep disinterest among investors, who began to view mining as a risky, volatile, and extremely cyclical investment. We discussed this in greater detail in the thesis on Foraco (TSX:FAR).
As always, the capital cycle comes into play: disinterest leads to reasonable prices for these assets, and once the price of gold rises again, highly attractive investment opportunities are created.
This opportunity materialized clearly in the Major Miners-to-Gold ratio, which expresses the price of miners relative to the metal.
While gold resumed its upward trend in 2020 due to the pandemic, monetary stimulus, and resulting inflation, miners failed to keep pace. By 2024, the ratio reached levels so low they signaled a clear arbitrage opportunity. Furthermore, the sector is now more concentrated, less leveraged, and allocates capital in a more balanced manner.
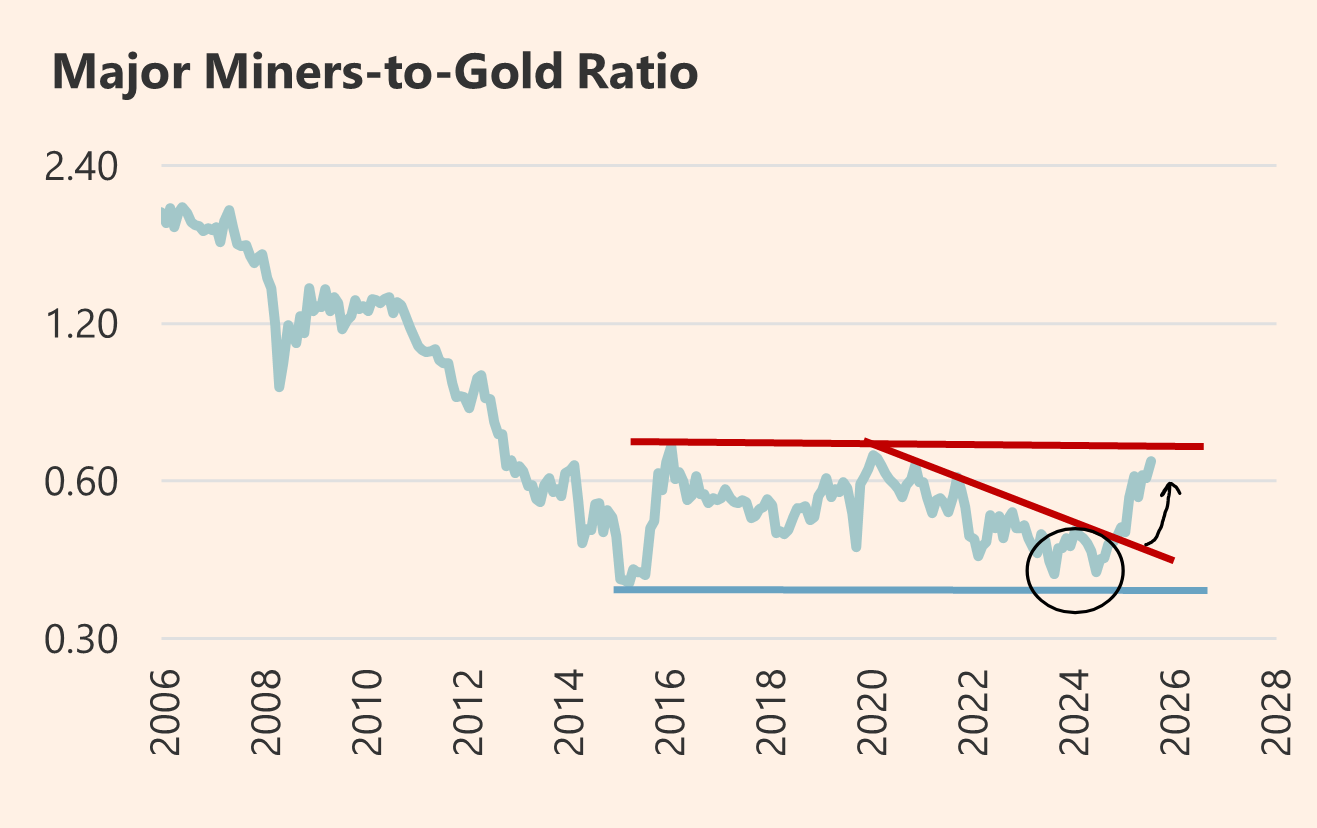
As the chart shows, the ratio is approaching resistance. After such a meteoric rise, it is only logical to ask: How much upside is left? Is it time to leave the last penny for the next guy?
These are not easy questions to answer, and one must feel comfortable with how their portfolio is constructed; therefore, I will try to offer the answers that I have applied myself.
Attempting an intrinsic valuation of an ETF with over 40 companies is a nightmare, but we can try to get close. We are going to do a napkin valuation, a method that oversimplifies things but is perfectly valid when backed by a solid macro thesis like the one we have.
The Napkin Math
According to the VanEck report from January 16, 2026, gold miners are trading at an NTM P/E of between 14x and 15x. It is important to note that this relative valuation was calculated with gold at $3,400/oz, while the price currently stands at $4,950/oz.

This implies that there will be a quarter where miners' revenue per ounce will be closer to $5,000 than to the $3,400 reflected in that 14-15x multiple (a 47% difference). To this, we must add operating leverage.
The sector's average All-In Sustaining Cost (AISC) is approximately $1,600/oz. Therefore, every dollar the gold price rises above that implied $3,400 flows almost entirely to the bottom line.
Obviously, costs could rise: gold may become harder to mine, costs could increase due to higher demand for services, or staff shortages... These costs will trend upward in the medium term. We will be conservative with this.
In the following chart, I have overlaid the price of gold onto VanEck’s NTM P/E series. The gold price doesn't have its own scale, but it serves to illustrate the key point: this is a cyclical industry, and as in many others, the highest valuations are reached at the lowest multiples. And that is exactly where we are, except for the fact that gold seems to have no ceiling.
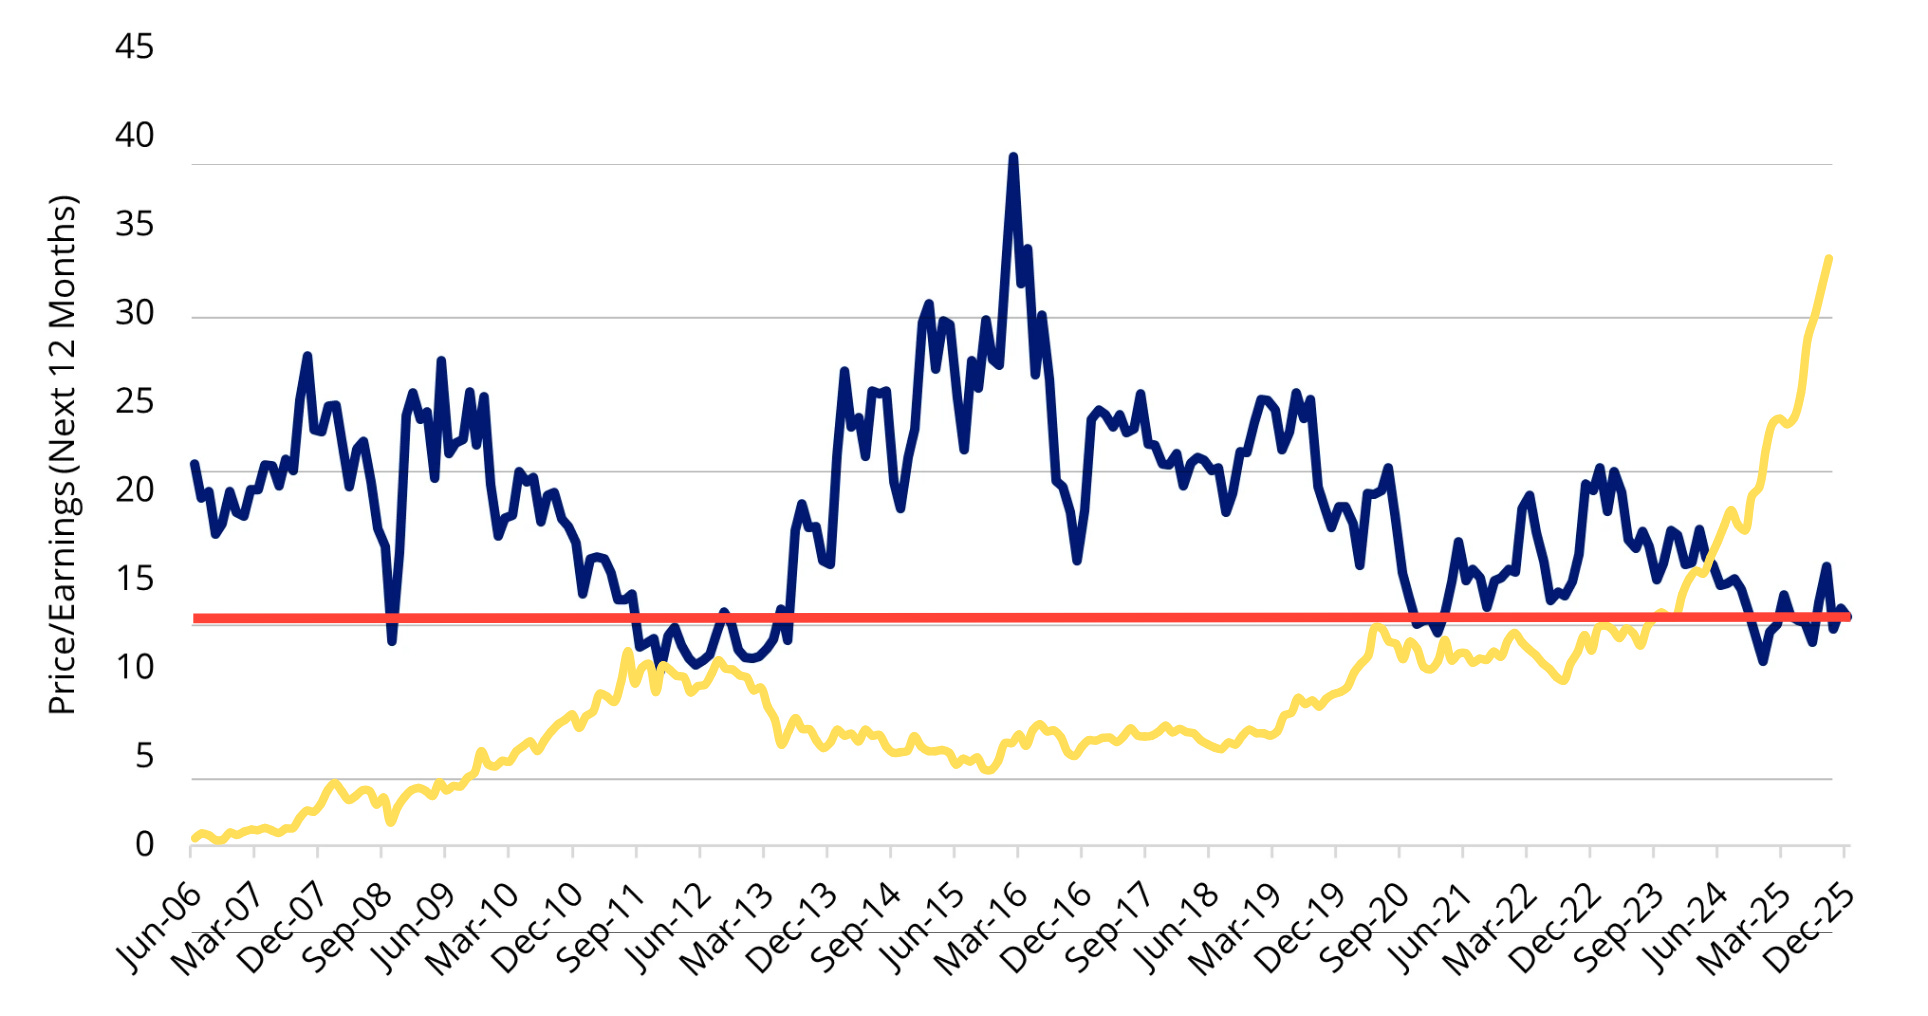
Based on the scenario implied in the VanEck report (12/31/2025), at current gold prices and with costs held ‘ceteris paribus’, the multiple would drop from 14.50 to 9.55 NTM P/E. This implies a potential annual earnings growth of 86%, assuming every ounce is sold at current spot prices.
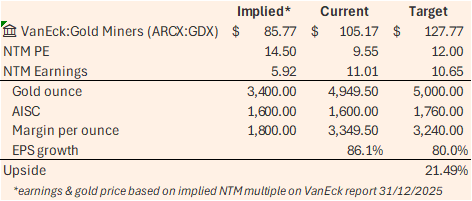
Adjusting this scenario with a 10% increase in AISC, holding gold at $5,000, and applying a 12x multiple, the ETF would reach a price of $127, providing a potential 21% upside from current prices on a one-year horizon.
Before wrapping up, a note of caution: everyone must find their own comfort level when managing an asset currently trading at all-time highs. It makes sense to try and capture the full potential of this trend, but nobody ever knows exactly when the music will stop. Remember to be greedy when others are fearful, and fearful when others are greedy.
Thanks for reading the Pond Journal🦆. If you enjoyed it, don’t forget to leave a like 👍subscribe🖊️ and share🔄 it.
DISCLAIMER: All the information provided in this document is purely informative and does not constitute a buying recommendation (according to Spanish Law Article 63 of Law 24/1988, of July 28, on the Stock Market Regulator, and Article 5.1 of Royal Decree 217/2008, of February 15). DuckPond Value Research is not responsible for the use of this information. Before investing in a real account, it is necessary to have the appropriate training or delegate the task to a duly authorized professional.
Reach us on duckpond@duckpondvr.com